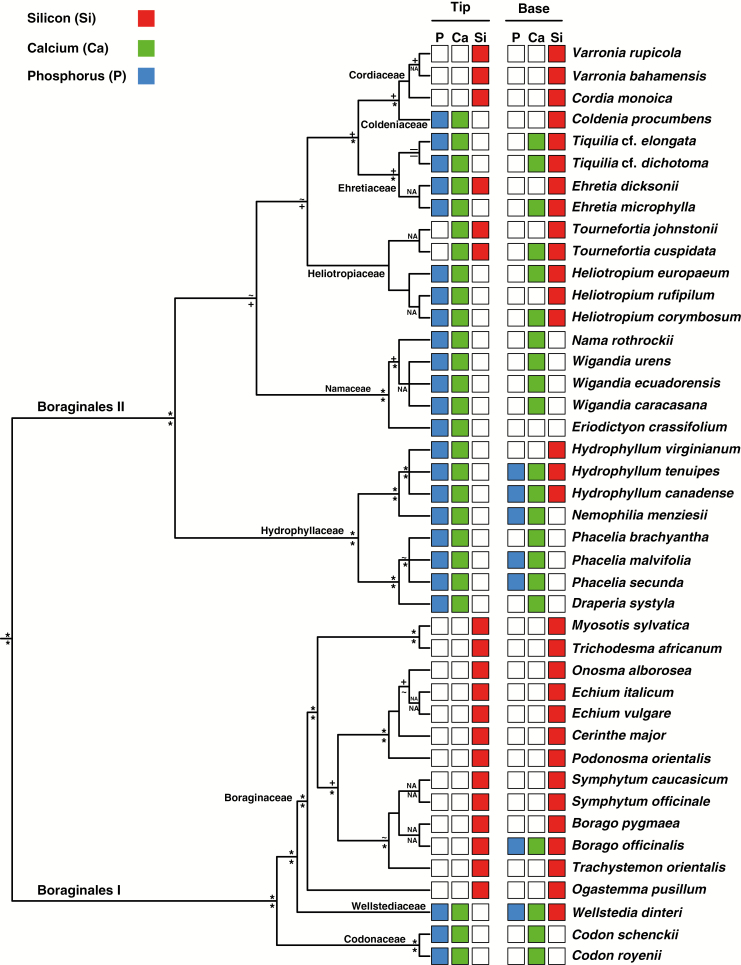
Fig. 3.
Phylogeny of the Boraginales with specific trichome zones plotted onto the terminal branches. The selected colours demonstrate the principal distribution of the elements Si (red), Ca (green) and P (blue). The backbone topology is based on Weigend et al. (2014). The topologies of some of the individual families are based on the following publications: Boraginaceae, Chacón et al. (2016); Ehretiaceae, Gottschling et al. (2014); Hydrophyllaceae, Walden et al. (2014); Cordiaceae, Hamilton (2016). Support values are taken from Weigend et al. (2014) and the above cited sources. Symbols above the lines indicate Bayesian posterior probability, while those below the lines indicate maximum-likelihood bootstrap support. Clades with an asterisk (*) are very highly supported groups (Bayesian posterior probability = 1.0, likelihood bootstrap value 100). Clades marked with a (+) are moderately supported (Bayesian posterior probability 0.99–0.9, maximum-likelihood bootstrap values 99–75) in Weigend et al. (2014). Clades with a tilde (~) are weakly supported (Bayesian posterior probability 0.89–0.80, maximum-likelihood bootstrap values 74–50). Clades marked with a minus sign (–) have no support (Bayesian posterior probability <0.80, maximum-likelihood bootstrap values <50), whereas non-assigned support values are shown as ‘NA’.

