
Fig. 1.
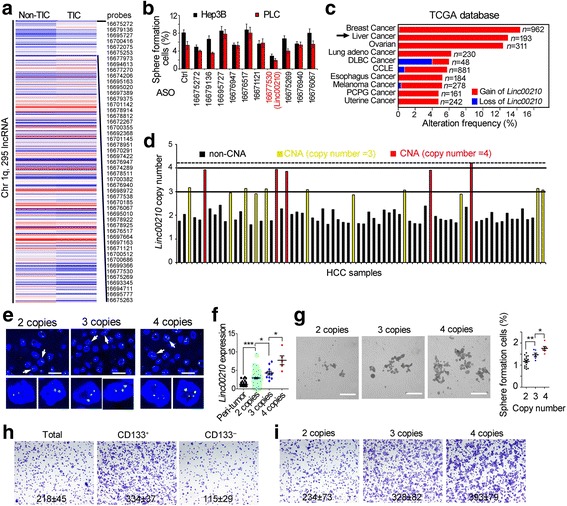
Copy number gain of linc00210 in liver cancer. a Heat map of lncRNA expression levels in liver TICs and non-TICs. 295 lncRNAs located on Chromatin 1q were shown, and the top 50 highly expressed lncRNAs in liver TICs were listed in right. b Histogram of sphere formation ratios. Hep3B and PLC were transfected with the indicated antisense oligo, followed by sphere formation. 1000 cells were used for sphere formation assay. c Linc00210 copy number analysis using TCGA datasets. Linc00210 showed high frequency of copy number gain in breast cancer and liver cancer. d Realtime PCR confirmed the CNA of linc00210. 72 HCC DNA samples were extracted, and primers targeting linc00210 DNA were used, primers targeting β-actin DNA were used for loading control. e Linc00210 DNA FISH validated its copy number gain. According realtime PCR data of 1D, 2 copy samples, 3 copy samples and 4 copy samples were collected for linc00210 DNA FISH. For each group, 5 samples were confirmed. Scale bars, 10 μm. f The relationship between linc00210 copy number gain and linc00210 transcript expression. Peri-tumor and HCC samples with 2, 3, 4 linc00210 copy numbers were analyzed for linc00210 expression. g Sphere formation assays were performed using linc00210 copy number gained samples and control samples. Typical images were shown in left panels and scatter diagram were shown in right panels. Scale bars, 500 μm. h CD133+ TICs and CD133− non-TICs were enriched by FACS and invasive capacity was examined by transwell assay. Typical images and cell numbers (mean ± s.d.) were shown. i Primary cells derived from HCC patients with linc00210 2 copies, 3 copies and 4 copies were examined for invasive capacity. Typical images and cell numbers (mean ± s.d.) were shown. 5 samples were examined for each group. *P < 0.05; **P < 0.01; ***P < 0.001 by two-tailed Student’s t test. Data are representative of three independent experiments