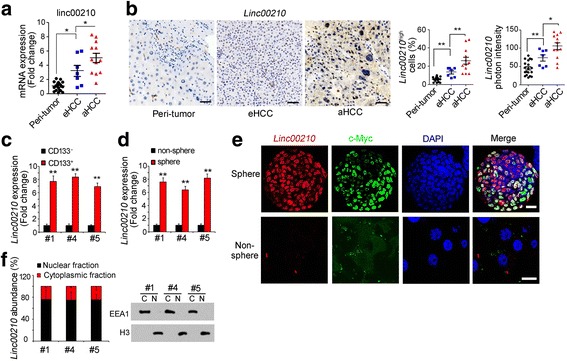
Fig. 2.

High expression of linc00210 in liver cancer and liver TICs. a Scatter diagram of linc00210 expression in the indicated samples. RNA extracted from 19 peri-tumor, 7 early HCC samples and 12 advanced HCC samples was used for linc00210 detection, ACTB served as loading control. b Linc00210 expression and subcellular location in indicated samples were analyzed by in site hybridization (ISH). Typical images were shown in left panels and analyzed data were shown in right panels. Peri-tumor tissues, early HCC and advanced HCC tissues were used for linc00210 staining. Because of different severity extent and heterogeneity between HCC samples, the staining looks very different. For every cell nucleus, Linc00210 photon intensity > 100 were Linc00210high cells. Three digoxin-labeled probes were used for linc00210 staining and their sequences were GCAAAAGGAAAAATCTGTTAG, TACCAGAAGGGCCTGTAAAG and CTCCTTCACCCTTATAAGCCT. c, d Linc00210 expression levels in CD133+ liver TICs (c) and oncospheres (d) were analyzed using realtime PCR. Sample #1, #4 and #5 can form oncospheres in vitro and have CD133+ liver TICs. e Linc00210 expression profiles in oncospheres were analyzed with fluorescence in situ hybridization (FISH) assays. c-Myc, a well-known liver TIC marker, was used as a control. Primary cells from sample #1 were used for sphere formation and staining. f Oncospheres were collected and nucleocytoplasmic segregation was performed. The nuclear and cytoplasmic fractions were used for RNA extraction, followed by realtime PCR for linc00210 expression (left panels). The efficiency of nuclear cytoplasmic segregation was confirmed by Western blot (right panels). Sample #1, #4 and #5 were used for nucleocytoplasmic segregation. Scale bars, for B, 50 μm; for E, 10 μm. Throughout figure, data were shown as means±s.d. *P < 0.05; **P < 0.01; ***P < 0.001 by two-tailed Student’s t test. Data are representative of three independent experiments
