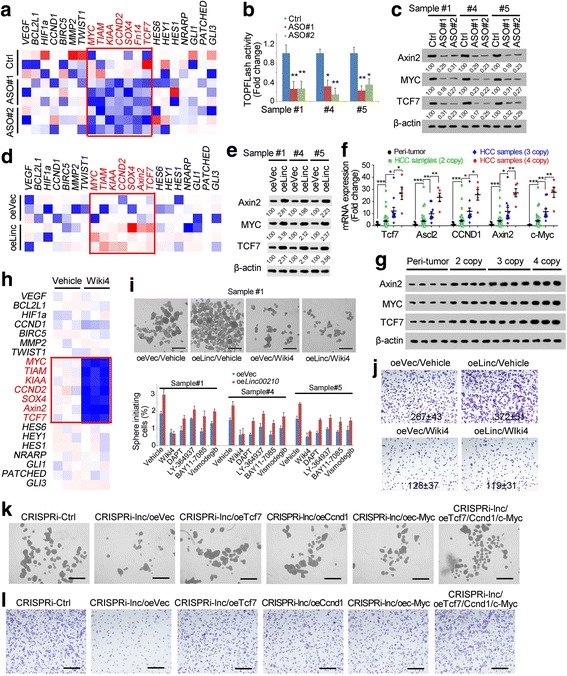
Fig. 4.

Linc00210 participated in Wnt/β-catenin activation. a Heat map of indicated target genes in linc00210 silenced and control cells. The target genes of Wnt/β-catenin signaling pathway (red genes) were decreased in linc00210 silenced cells. b TOPFlash assay of linc00210 silenced cells. TOPFlash and FOPFlash vectors were transfected into linc00210 silenced cells and control cells, and luciferase intensity was detected 36 h later. c Western blot of Wnt/β-catenin target genes. Linc00210 silenced and control cells were used for western blot. β-actin served as a loading control. The relative intensity was normalized to control (Ctrl) samples and shown below. d Heat map of target genes of self-renewal associated pathways. Wnt/β-catenin was activated upon linc00210 overexpression. e Wnt/β-catenin activation in linc00210 overexpressed cells was examined by Westen blot. f, g Linc00210 copy number gained samples, non-gained samples and peri-tumor cells were analyzed for Wnt/β-catenin activation by detecting expression levels of target genes by realtime PCR (f) and Western blot (g). h Heat map of Wiki4 treated cells and control cells. i Self-renewal capacities of the indicated treated cells were analyzed using sphere formation assay. Linc00210 was overexpressed in indicated treated and control cells, followed by sphere formation assays. Typical images were shown in upper panels and liver TIC ratios were shown in lower panels. j Wnt/β-catenin activation was inhibited in linc00210 overexpressed and control cells, followed by transwell assay for invasive capacity. Typical images and cell numbers (mean ± s.d.) were shown. k The indicated Wnt/β-catenin targets were rescued in linc00210 silenced cells, followed by sphere formation assay, and typical images were shown. Scale bars, 500 μm. Data were shown as means±s.d. l The indicated cells were used for transwell assay for invasive capacity and typical images were shown. Scale bars, 500 μm. For a, d, h, red represents high expression and blue represents low expression. **P < 0.01; ***P < 0.001 by two-tailed Student’s t test. Data are representative of three independent experiments
