Fig. 5.

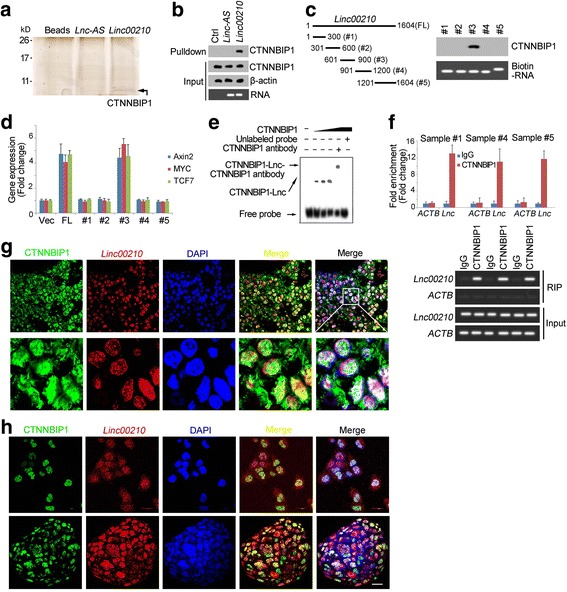
Linc00210 interacted with CTNNBIP1. a RNA pulldown assays were performed and samples were separated with SDS-PAGE and silver staining. Linc00210 specific band was identified as CTNNBIP1 by Mass Spectrum. b The interaction between linc00210 and CTNNBIP1 was confirmed by Western blot. Only linc00210 can bind to CTNNBIP1. c The indicated regions of linc00210 were constructed and their interaction with CTNNBIP1 was analyzed using RNA pulldown and Western blot assays. d Linc00210 full length (FL) and the indicated truncates were overexpressed in sample #1 cells and the expression levels of Axin2, MYC and TCF7 was examined by realtime PCR. e RNA electrophoretic mobility shift assay (RNA EMSA) was performed using linc00210 region#3 and CTNNBIP1 proteins. CTNNBIP1 antibody was used for super shift. f RNA immunoprecipitation was performed using CTNNBIP1 antibody and control IgG, and the enrichments were analyzed using realtime PCR. Upper panels were fold enrichment and lower panels were gel results. ACTB served as a negative control. Data were shown as means±s.d. g HCC primary samples were stained with linc00210 probes and CTNNBIP1 antibody, followed by observation with confocal microscope. h Co-localization of linc00210 and CTNNBIP1 in liver TICs (upper panels) and oncospheres (lower panels). Linc00210 probes and CTNNBIP1 antibody were used for staining. Scale bars, 20 μm. For G, H, three probes were labeled with digoxin for linc00210 staining and their sequences were GCAAAAGGAAAAATCTGTTAG, TACCAGAAGGGCCTGTAAAG and CTCCTTCACCCTTATAAGCCT. Data are representative of three independent experiments
