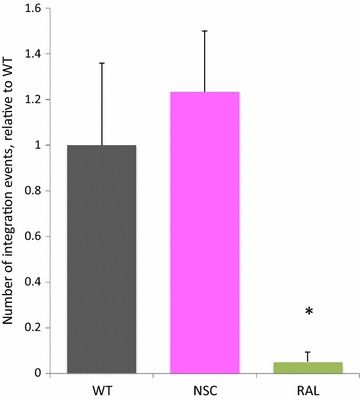
Fig. 1.

Viral integration levels determined in the presence and absence of NSC and integration inhibitor. Jurkat cells were pre-treated with NSC [100 µM] or raltegravir [1 µM], and infected with LAI 6 h post-treatment in the presence or absence of 50 µM NSC or 500 nM raltegravir. 24 h post-infection, cells were harvested and subjected to DNA extraction and HIV-1 integration was assayed by Alu-gag PCR followed by quantification of integration events by HIV-1 gag qPCR. The number of integration events relative to LAI-infected cells (WT) in the presence of NSC or raltegravir is shown. For each sample, variations in the amount and quality of cellular DNA input was accounted for by dividing the number of HIV-1 integration events detected by the HIV-1 gag qPCR by the relative actin level detected in the input DNA for the Alu-gag PCR. All samples were then normalized relative to one another such that the average WT value was 1. The average of three samples is shown for each condition. Error bars represent SD. *Statistically significant from WT by Student’s t test, p < 0.05)
