Fig. 2.

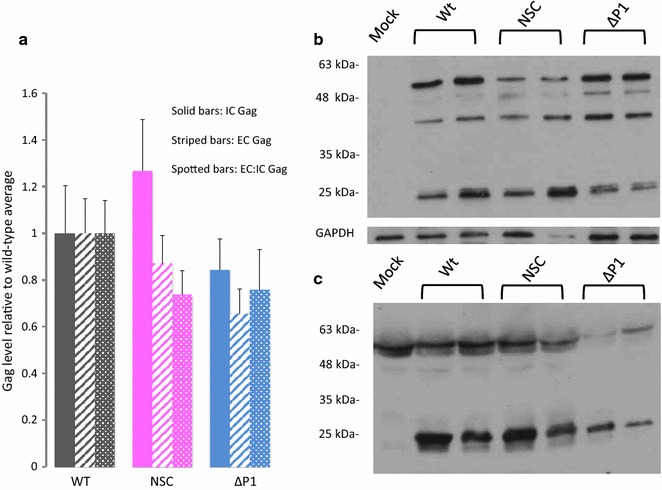
Viral Gag production in the presence and absence of NSC. 293T cells were transfected with HIVΔEnv (WT and NSC) or HIVΔp1ΔEnv (Δp1) and VSV-G expression plasmids. 6 h post-transfection, cells were treated with 50 μM NSC (NSC) or the equivalent quantity of DMSO (WT and Δp1). 24 h post treatment, supernatants and cells were harvested. Equal volumes of samples were electrophoresed on SDS-PAGE gels and immunoblots performed using anti-p24/p55 antibody. Cellular blots were stripped and reprobed with anti-GAPDH antibody. a Results of cellular, supernatant and supernatant:cellular Gag expression levels, quantified using densitometry. Results show an average of four independent experiments, each containing 3–6 replicates (with each replicate examining an independently transfected well of a six-well plate) of each experimental condition. b Anti-Gag Western blot showing intracellular Gag expression levels, and anti-GAPDH control. Two experimental replicates, from independently transfected wells are shown (c) anti-Gag Western blot showing extracellular Gag expression. Two experimental replicates from independently transfected wells are shown
