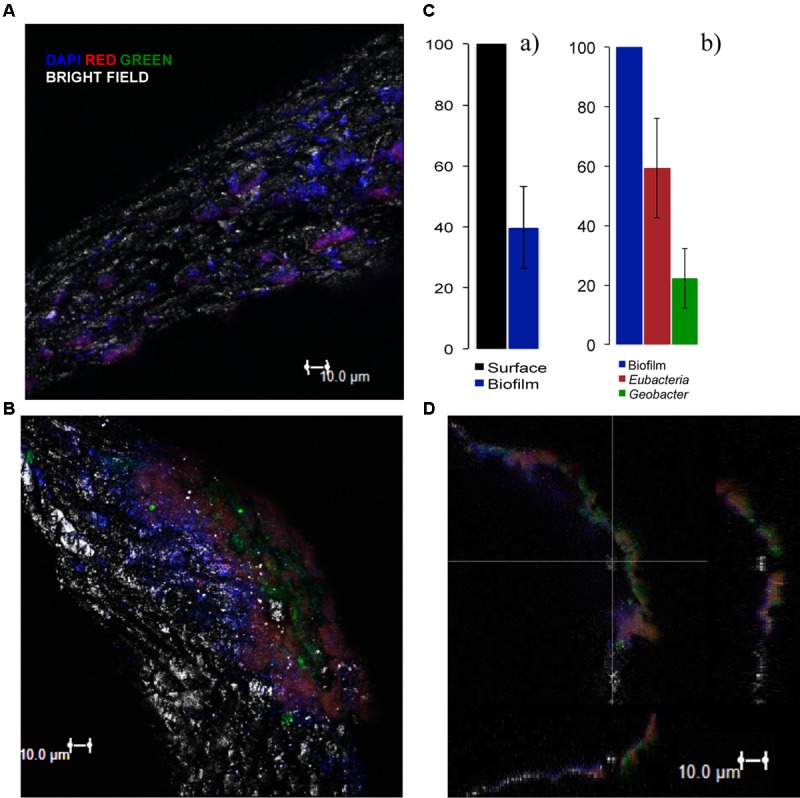
FIGURE 6.

Fluorescence in situ hybridization (FISH) results on the polarized particles using DAPI (blue signal, all nucleic acids) and the following probes: for (A) Eubacteria probe (red signal) and Geobacter cluster probe (green signal) (probes combination 4) and for (B) Eubacteria (green signal) and Archaea probe (red signal) (probes combination 5). (A,B) 3D Images projected from a sequence of images (sections were taken at 2-μm interval) of the biofilm formed over the surface of the particles (bright field). (C) (a) Biomass coverage of the fluidized particles (average of 2 independent projected sequences) and (b) relative abundance of Eubacteria and Geobacter cluster estimated from at least 2 sequences of images taken for each sample (average of 3 independent projected sequences). (D) Sections of the biofilm from image B in the 3 dimensions. The 3D images were built by the software from projected sequences of 18 images, each one with an interval of 2 μm.
