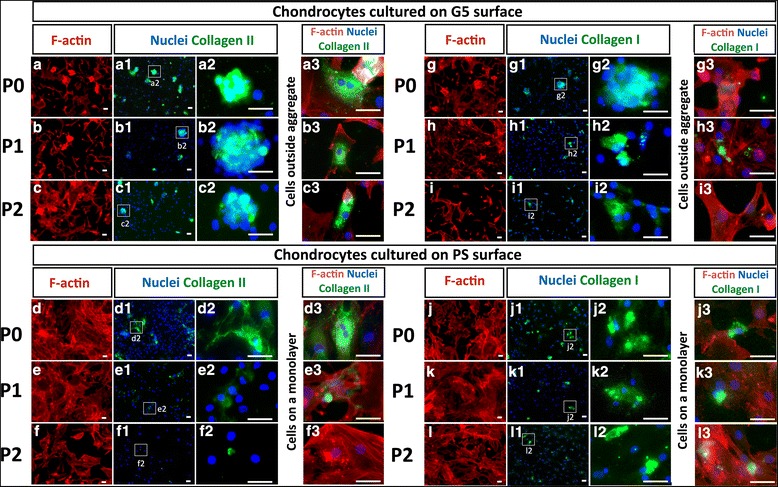
Fig. 3.

Immunofluorescence staining for collagen type II (a1-f3), collagen type I (g1-l3) (green), F-actin (a-l) (red), and nuclei (blue) in human chondrocytes at passage 0–2 on G5 and PS surfaces. Panels a2-l2 show the enlargments of white box areas in panels a1-l1, respectively. Scale bars show 100 μm
