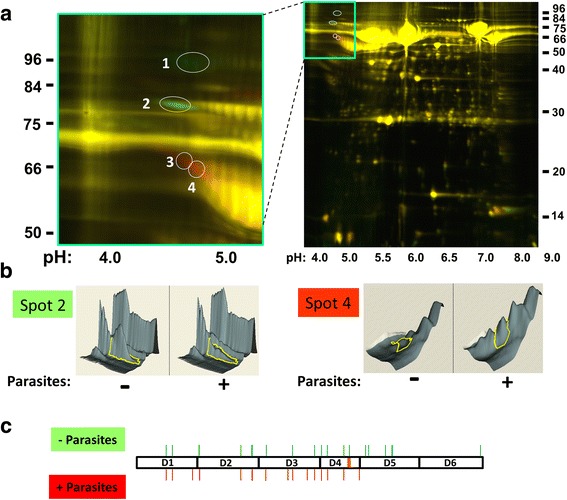
Fig. 1.

Impact of schistosomes on the mouse plasma proteome. a Image (right) showing 2D gel resolution of samples obtained following normal heparinized mouse plasma incubation for 1 h at 37 °C either in the presence of schistosome parasites (red) or without parasites (green). Most proteins are the same in both samples and appear yellow. The numbers on the sides of the images represent molecular mass markers (kDa) and the numbers at the bottom represent pH values. The section containing protein spots of interest is bounded by a green box at the top and this section is magnified and shown on the left. Four spots are circled and numbered. Two exhibits greater relative abundance in the absence of parasites (green spots 1, 2); two are more abundant in the presence of parasites (red spots 3 and 4). b Gel spot analysis by DeCyder software. The left panel depicts an analysis of gel spot 2. Here the sizable protein peak (bounded by a yellow line in the figure) that is seen in the control sample (- parasites) is greatly diminished in the sample containing parasites (+ parasites). Spot 4, right panel, shows the opposite effect in which the identified spot is barely detectable in the control sample (-) but becomes prominent in the presence of the worms (+). c Diagrammatic representation of the HK protein with its 6 domains (D1-D6). The 9-amino acid vasodilator bradykinin is contained within domain 4 and is indicated by an orange line. The positions of peptides that were identified by mass spectroscopy following trypsin digestion of 2D-DIGE spots 1 and 2 are indicated by thin green lines protruding above the HK protein. Positions of peptides identified by mass spectroscopy following trypsin digestion of 2D-DIGE spots 3 and 4 are indicated by red lines protruding below the protein
