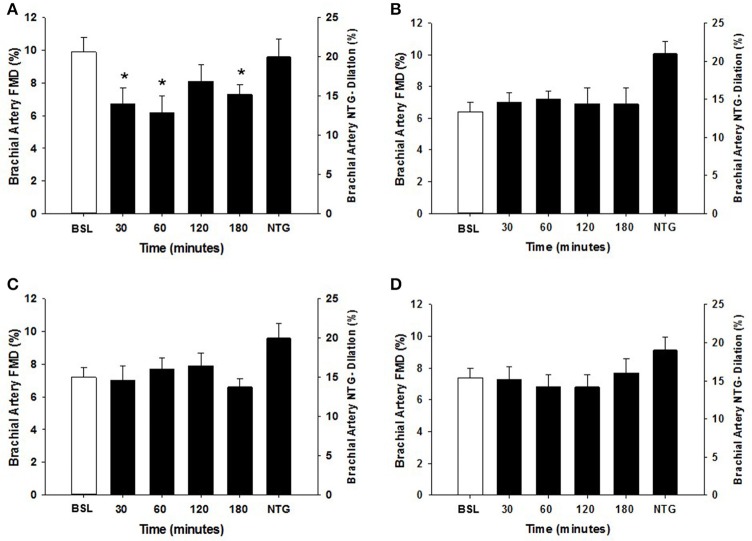
Figure 2.
Brachial artery FMD responses to a 75 g glucose high sugar meal (HSM) at baseline, and 30, 60, 120, and 180 min post-ingestion in (A) sedentary participants (n = 11), (B) runners (n = 12), (C) weight lifters (n = 13), and (D) cross-trainers (n = 9). Brachial artery FMD scale is on the left Y-axis. Nitroglycerin (NTG) mediated dilation is depicted on the right Y-axis. All data presented as mean ± SEM. *Indicates significant difference compared to baseline FMD measure (adjusted P < 0.05; Sidak-Bonferroni adjustment for ANOVA multiple comparisons).

