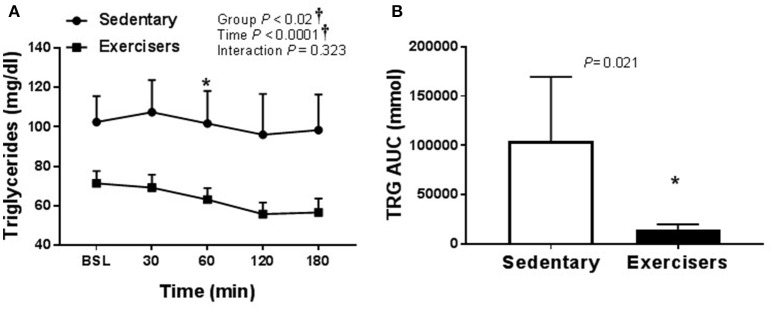
Figure 6.
Serum triglycerides responses to a 75 g glucose high sugar meal (HSM) at baseline, and 30, 60, 120, and 180 min post-ingestion in sedentary participants (n = 11) and exercisers (n = 33). (A) Serum triglyceride levels over 180 min. and (B) Serum triglyceride area under the curve (AUC) over the 180 min postprandial period. All data presented as mean ± SEM. †Indicates significant main or interaction effect (P < 0.05). *Indicates significant difference between sedentary participants and exercisers (adjusted P < 0.05; Sidak-Bonferroni adjustment for ANOVA multiple comparisons).

