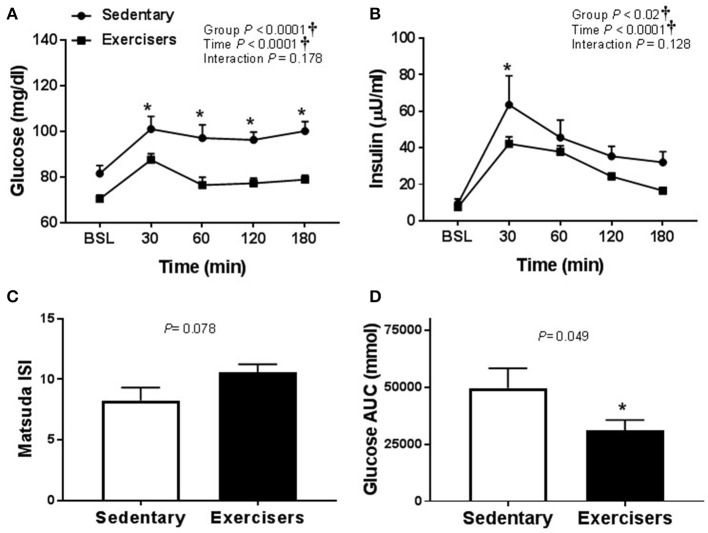
Figure 7.
Glucose homeostatic responses to a high fat mixed meal (HFMM) at baseline, and 30, 60, 120, and 180 min post-ingestion in sedentary participants (n = 11) and exercisers (n = 33). (A) Blood glucose response over 180 min. (B) Serum insulin levels over 180 min. (C) Matsuda insulin sensitivity index (ISI) and (D) Glucose are under the curve (AUC) over the 180 min postprandial period. All data presented as mean ± SEM. †Indicates significant main or interaction effect (P < 0.05). *Indicates significant difference between sedentary participants and exercisers (adjusted P < 0.05 after Sidak-Bonferroni adjustment).

