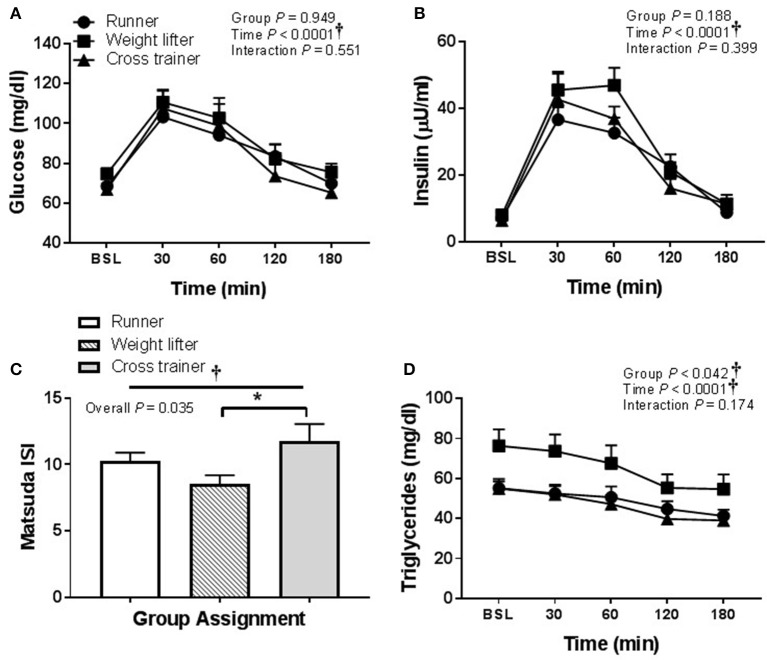
Figure 9.
Metabolic responses at baseline, and 30, 60, 90, 120, and 180 min to a 75 g glucose high sugar meal (HSM) in runners (n = 11), weightlifters (n = 13), and cross-trainers (n = 9). (A) Blood glucose response over 180 min. (B) Serum insulin levels over 180 min (C) Matsuda insulin sensitivity index (ISI) and (D) Serum triglyceride levels over 180 min. All data presented as mean ± SEM. †Indicates significant main or interaction effect (P < 0.05). *Indicates significant difference between groups (adjusted P < 0.05; Sidak-Bonferroni adjustment for ANOVA multiple comparisons).

