Fig. 4.

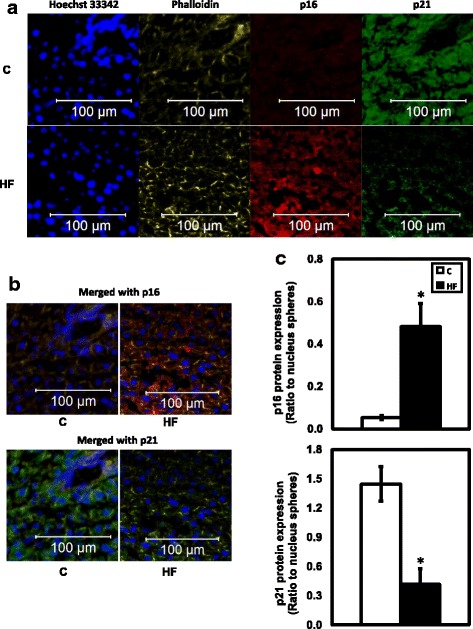
Confocal immunofluorescent pictures (× 10) of rat livers and protein expression analysis. a Single channel pictures of stained nucleus (blue), actin filament (yellow), p16 INK4a antibody Alexa Flour 647 conjugated (red), and p21 Cip1 antibody Alexa Flour 488 conjugated (green). b Merged pictures (p16 INK4a/actin/nucleus and p21 Cip1/actin/nucleus, respectively) are selected and presented respectively to visualize protein quantification and localization. c p16 (INK4a) and p21 (Cip1) quantified protein level in C and HF rats as determined by immunofluorescence signal intensity ratio to nucleus signal intensity (n = 5). Data are presented as protein immunofluorescent sphere area to nucleus sphere area. Values are mean ± SEM, P < 0.05*
