
Fig. 2.
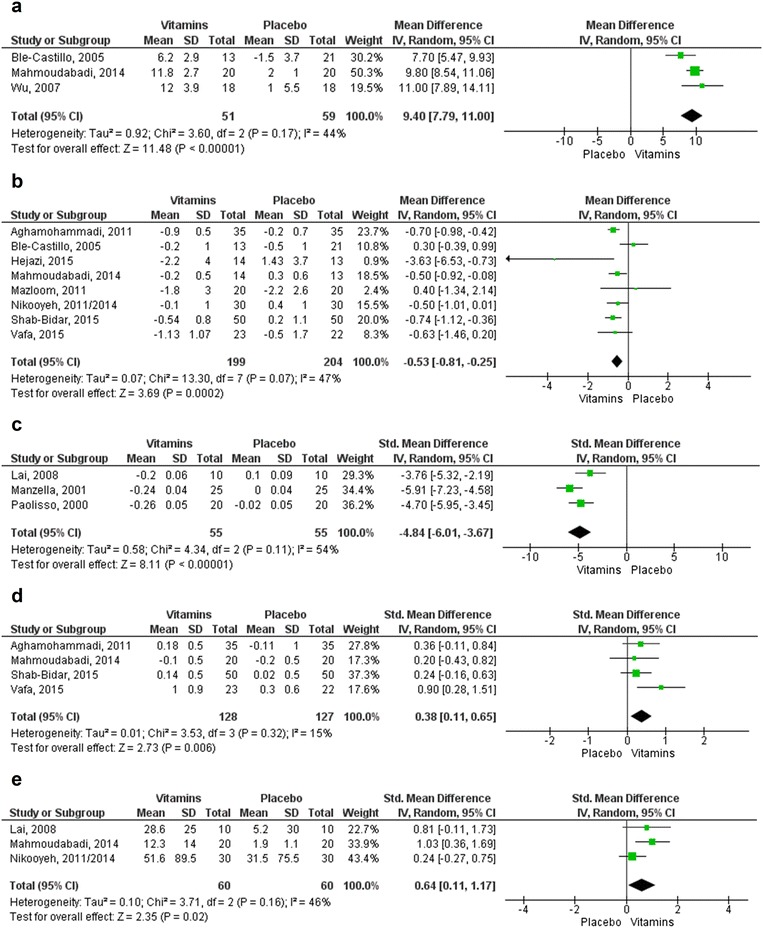
Forest plots for the outcomes of antioxidant status. a Augmentation of GPx level (U/g Hb). b Reduction of MDA (nmol/L). c Reduction of TBARS (µmol/L). d Changes in TAC (mmol/L). e Changes in SOD (U/g). Statistical method: Mean difference (MD) and Std. Mean Difference (SMD), IV, Random, 95% confidence interval