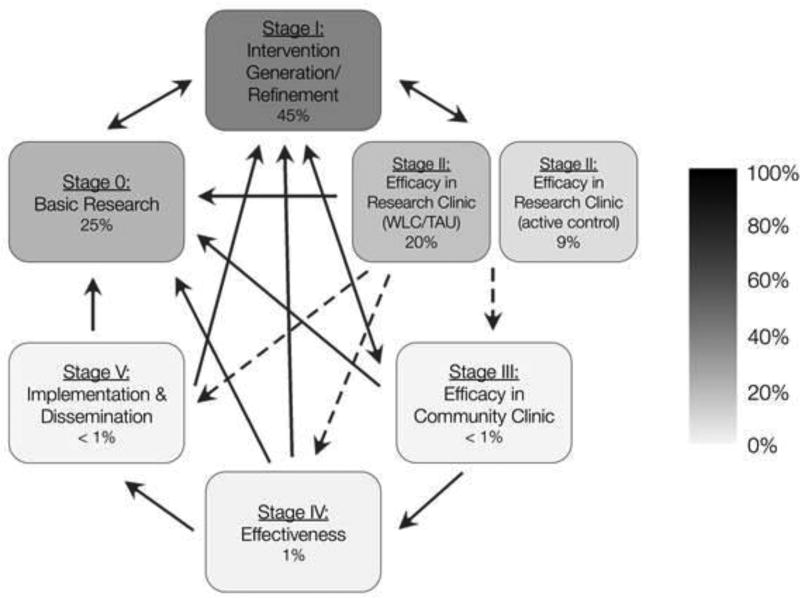
Figure 1.
Evidence base for MBIs (i.e., MBSR and MBCT) mapped according to the adapted NIH Stage Model. Recommended pathways between stages are represented with solid arrows; pathways that should be undertaken with caution are represented with dotted arrows. Color saturation represents the proportion of the total number of published studies of MBIs mapped at a given stage, with the specific percentage indicated at each stage.

