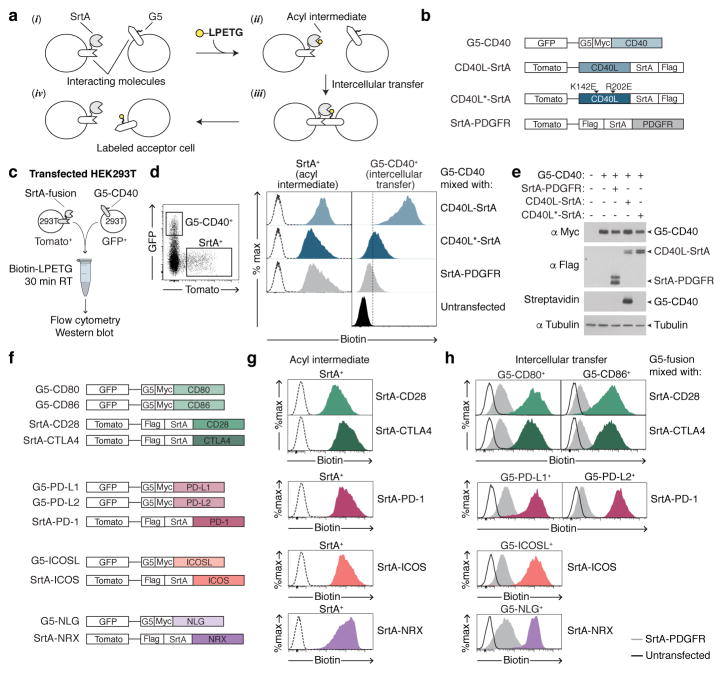
Figure 1. Using LIPSTIC to track ligand-receptor interactions.
a, Schematic representation of the LIPSTIC approach. b, Constructs used in c–e. All constructs express a bicistronic gene encoding for a fluorescent reporter protein. c, Experimental setup to probe intercellular labeling in transfected 293T cells. d, Gating strategy and histograms showing biotin staining in SrtA+ cells (left column, indicating the formation of the acyl intermediate) and G5-CD40+ cells (right column, indicating intercellular transfer). Dashed line histograms represent untransfected cells. e, Western blot showing expression of G5-CD40 (anti-Myc), SrtA fusion constructs (anti-FLAG), and intercellular labeling (Streptavidin). αTubulin, loading control. f, Constructs used in g–h. g, h, Biotin staining in SrtA+ cells (acyl intermediate) and G5+ cells (intercellular transfer). Dashed line histograms represent untransfected cells. Solid line histograms and gray histograms represent G5+ cells mixed with untransfected and SrtA-PDGFR donor cells, respectively. Data are representative of three independent experiments.

