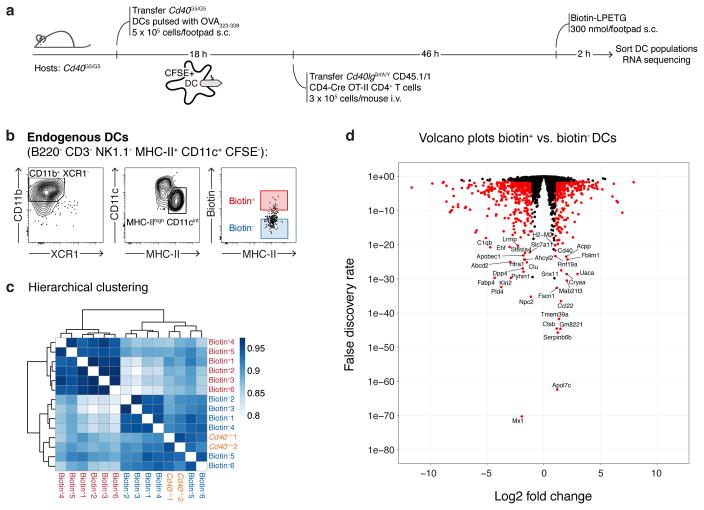
Extended Data Figure 10. RNA sequencing analysis of sorted biotin+ DCs.
a, Graphic representation of the protocol for DC sorting. 5 × 10⁵ Cd40G5/G5 CFSE-labeled DCs pulsed ex vivo with OVA323-339 were transferred subcutaneously into the hind footpad of Cd40G5/G5 recipients. Eighteen hours later, 3 × 10⁵ CD40lgSrtA/Y CD4-Cre OT-II CD4+ T cells were transferred intravenously. Biotin-LPETG was administered subcutaneously (300 nmol/footpad) during the last two hours before analysis. pLN were harvested 48 hours post-T cell transfer and DC populations were sorted by flow cytometry and later processed for RNA sequencing analysis. As controls, DCs were also sorted from Cd40−/− mice, which were treated as above except that they received WT (instead of Cd40G5/G5) DCs and WT OT-II (instead of CD40lgSrtA/Y CD4-Cre OT-II) CD4+ T cells. b, Gating strategy for sorting. Endogenous DCs were first identified as B220− CD3− NK1.1− MHC-II+ CD11c+ CFSE−. Sorting was restricted to CD11b+ XCR1− DCs showing an activated phenotype (MHC-IIhi), which represent the major population involved in bystander interactions. Biotin+ and biotin− DCs were gated as shown. c, Hierarchical clustering of transcriptomic profiles. Color scheme is based upon Pearson correlation. Data are derived from a single experiment, n=3. d, Volcano plots showing differential gene expression between biotin+ and biotin− DCs. All genes used for the differential expression analysis are shown; differentially expressed genes (log2 fold change > 1 and FDR < 0.05, see Methods section) are colored red. Data are derived from a single experiment, n=3.

