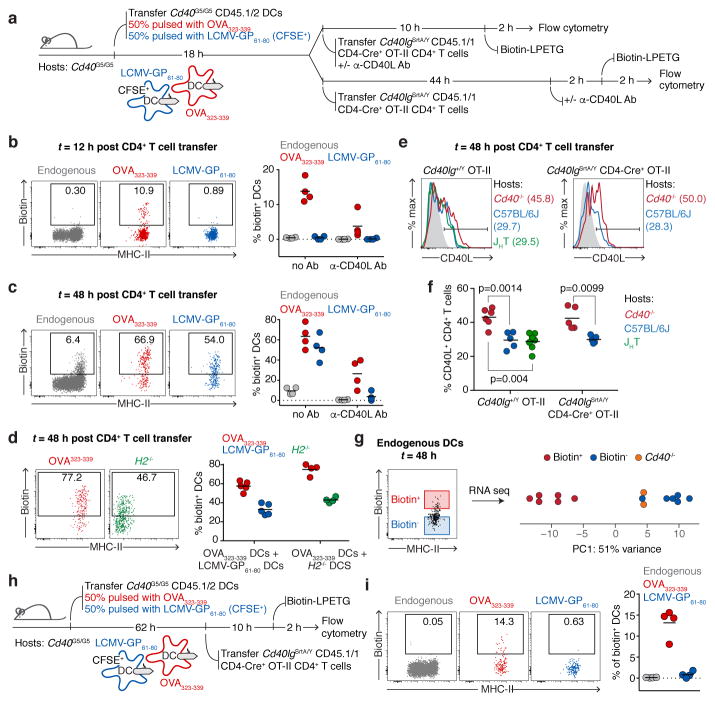
Figure 4. Different modalities of CD40-CD40L interaction between CD4+ T cells and DCs in vivo.
a, Experimental setup for b–c. b–c, Flow cytometric analysis of pLN cells showing biotin labeling of endogenous and transferred DCs 12 (b) or 48 (c) hours post-T cell transfer. d, Flow cytometry of pLN cells showing biotin labeling of transferred DCs 48 hours post-T cell transfer. Experimental set up as in a, except that bystander DCs are H2−/−. e, CD40L expression in activated CD4+ T cells. Histogram plots show CD40L surface staining in Cd40lg+/Y OT-II (left panel) or Cd40lgSrtA/Y CD4-Cre OT-II (right panel) CD69+ CD4+ T cells. Data representative of two independent experiments. f, Graph shows percentage of CD69+ CD4+ T cells positive for CD40L. One-way ANOVA with Tukey’s post-hoc test and unpaired, two-tailed Student’s t-test were used for statistical analysis. g, Principal component analysis of transcriptomic profiles of endogenous biotin+ and biotin− MHC-IIhi CD11c+ CD11b+ XCR1– DCs sorted 48 hours post-T cell transfer from mice treated as in a. Each symbol represents one sample derived from one mouse in a single experiment. h, Experimental setup for i. i, Flow cytometry of pLN cells showing biotin labeling of endogenous and transferred Cd40G5/G5 DCs 12 hours post-T cell transfer. Graph represents percentage of biotin+ DCs gated as shown among different DC populations. b–d, f, i, Each symbol represents one mouse; bar indicates mean; data pooled from two independent experiments.

