
Fig. 2.
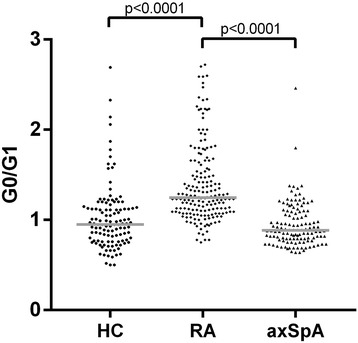
Immunoglobulin G (IgG) galactosylation in patients with rheumatoid arthritis (RA), patients with axial spondyloarthritis (axSpA), and healthy control subjects (HC). Comparison of agalactosylated immunoglobulin G/monogalactosylated immunoglobulin G (G0/G1) ratios in RA (n = 178), axSpA (n = 126), and HC (n = 119) is shown. Horizontal lines indicate median of distribution. p Values derived by Mann-Whitney U test are indicated