
Fig. 3.
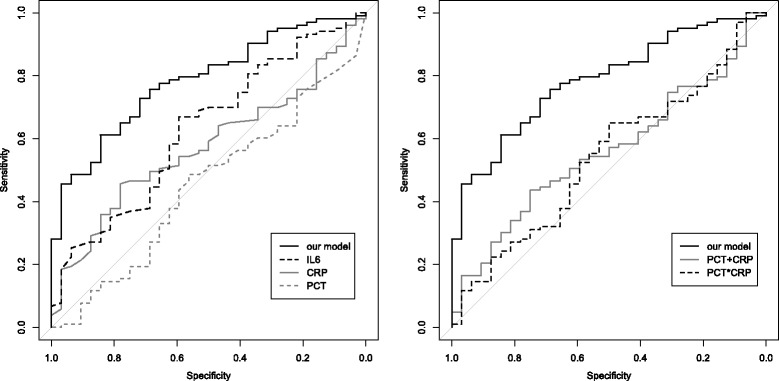
ROC analysis comparing the diagnostic performance of the developed model against previously proposed biomarkers. Left panel: The ROC curve of our proposed model (solid black line; AUC: 0.78; 95% CI: 0.70–0.87) was compared against previously proposed single biomarkers in the test data set. C-reactive protein (CRP, solid grey line; AUC = 0.57; 95% CI: 0.47–0.68), interleukin-6 (IL-6, dot-dashed black line; AUC = 0.63; 95% CI: 0.52–0.74) and procalcitonin (PCT, dashed grey line; AUC = 0.55; 95% CI: 0.34–0.56). Specificity represents the correct identification of sepsis, sensitivity the correct identification of SIRS cases. Right Panel: The ROC curve of our proposed model (solid black line; AUC: 0.78; 95% CI: 0.70–0.87) was compared against previously proposed combinations of biomarkers. CRP and PCT based on a logistic regression model allowing (dot-dashed black line; AUC = 0.54; 95% CI: 0.43–0.65) and not allowing for interaction (solid grey line; AUC = 0.56; 95% CI: 0.45–0.66). Specificity represents the correct identification of sepsis, sensitivity the correct identification of SIRS cases