
Fig. 3.
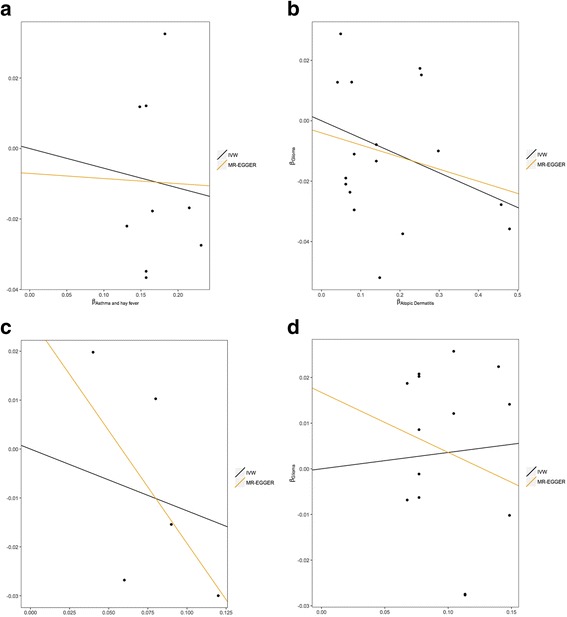
Scatter plots of genetic associations with glioma against genetic associations with the exposure. a Asthma and hay fever, b atopic dermatitis, c IgE level, d self-reported allergy
Official websites use .gov
A
.gov website belongs to an official
government organization in the United States.
Secure .gov websites use HTTPS
A lock (
) or https:// means you've safely
connected to the .gov website. Share sensitive
information only on official, secure websites.
Scatter plots of genetic associations with glioma against genetic associations with the exposure. a Asthma and hay fever, b atopic dermatitis, c IgE level, d self-reported allergy