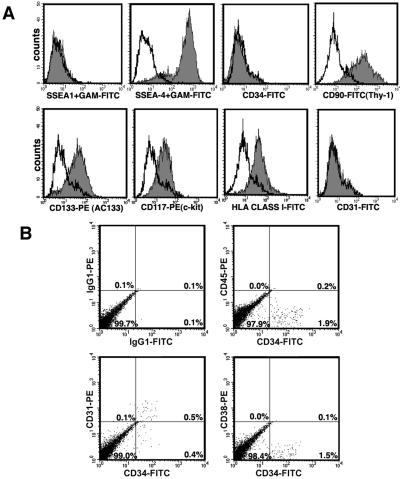
Figure 1.
Flow cytometric analysis of undifferentiated human ES (H1) cells and differentiated H1 cells. (A) Undifferentiated H1 cells analyzed by single-color flow cytometry. Appropriate isotype control antibody is demonstrated by line and indicated antibody by filled plot. SSEA-1 and SSEA-4 were unconjugated antibodies and a secondary FITC-conjugated goat anti-mouse (GAM) antibody was used. All other antibodies were directly conjugated to flurochrome. (B) H1 cells allowed to differentiate on S17 cells (H1/S17 cells) analyzed by two-color flow cytometry. Percentages of positive cells are indicated in each quadrant.

