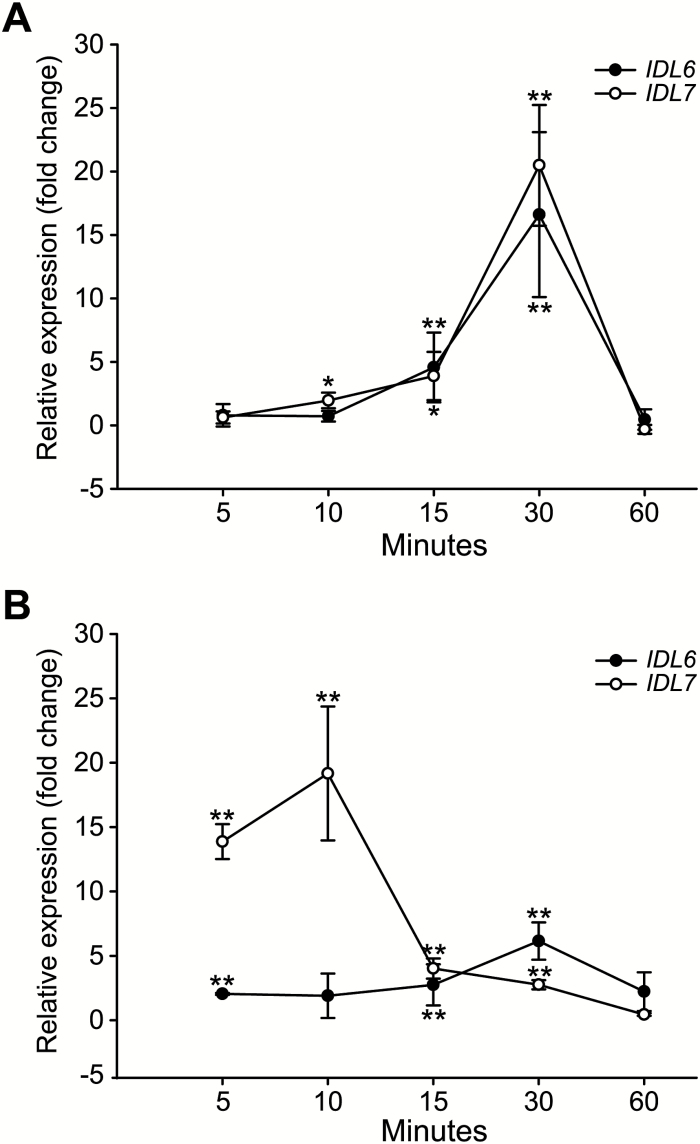
Fig. 6.
Time series analysis of IDL6 and IDL7 expression by qRT–PCR after flg22 treatment (A) and H2O2 treatment (B) compared with untreated tissue (n=4). Statistical differences (REST analysis: *P-value <0.05; **P-value <0.01) between the time point samples and control are indicated. Error bars indicate SDs.

