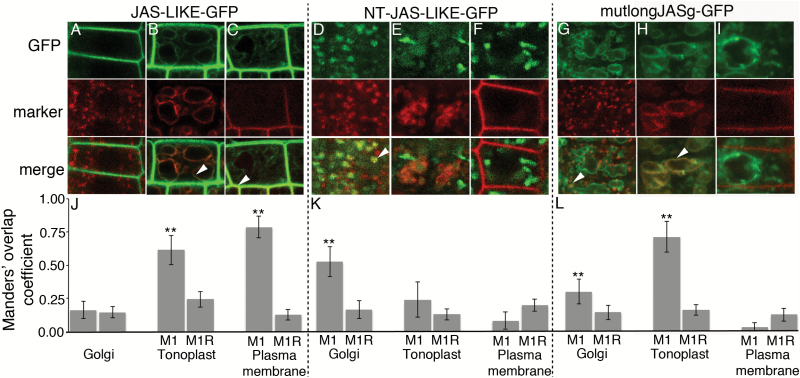
Fig. 3.
Subcellular localization of different versions of JAS-LIKE–GFP and JAS–GFP with a mutated N-terminal region. CLSM images showing colocalization of JAS-LIKE GFP (A–C), NT-JAS-LIKE–GFP (D–F) and mutlongJASg–GFP (G–I) with fluorescent markers for the Golgi (A, D, G), tonoplast (B, E, H), and plasma membrane (C, F, I) in root cells. The top panels show GFP fluorescence (green), the middle panels show marker fluorescence (red), and in the bottom panels colocalization can be visually assessed by a yellow color in merged images with examples highlighted with an arrowhead. Differences in marker morphology reflect differences in cell type and age due to the selection of cells being based on having both fluorescence signals that varied in location between roots. Scale bars: 5 μm. (J–L) Quantification of colocalization. For each combination of JAS–GFP and marker the mean (±SD) Manders’ overlap coefficient 1 value (M1) from 20 images is shown along with the mean (±SD) for the same red image with the green image randomized (M1R). **M1 value is significantly higher than the M1R value (t-test, P<0.001). Similar results were observed for two or three individual transgenic lines.

