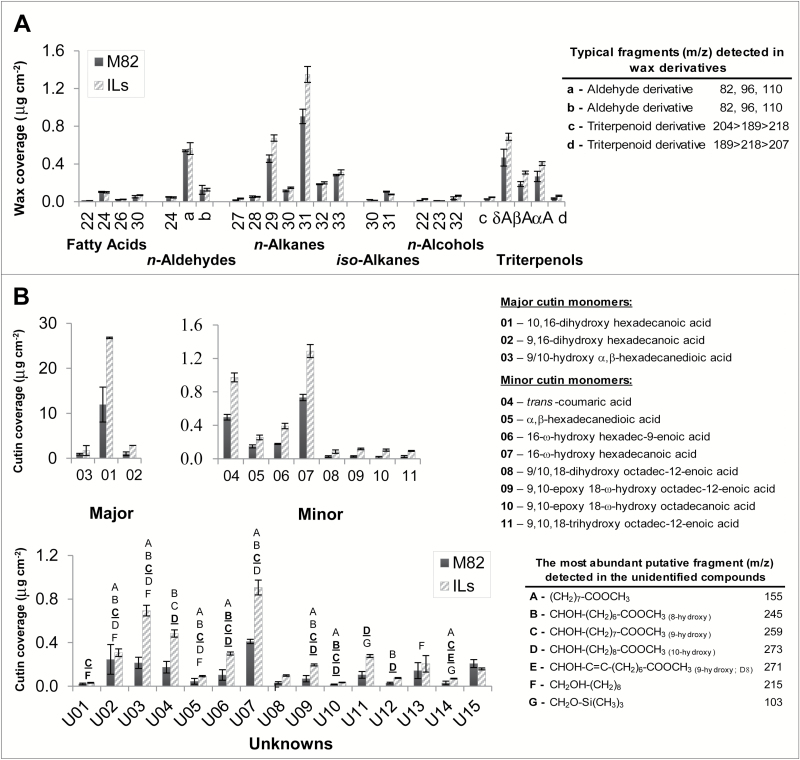
Fig. 1.
Changes in cuticular lipid coverage in the S. pennellii IL population. A. Wax coverage. B. Cutin monomer coverage. For the bars representing the parental S. lycopersicum cultivar M82, n=3; bars for ILs represent pooled data (n=63 and n=73 for wax and cutin monomer datasets, respectively). In A, aldehyde derivatives that were detected in the population are shown as a and b; triterpenol derivatives are shown as c and d. In B, uncharacterized cutin monomers are represented by ‘U’ and some of their structural information is provided. Data are presented as mean±SD.

