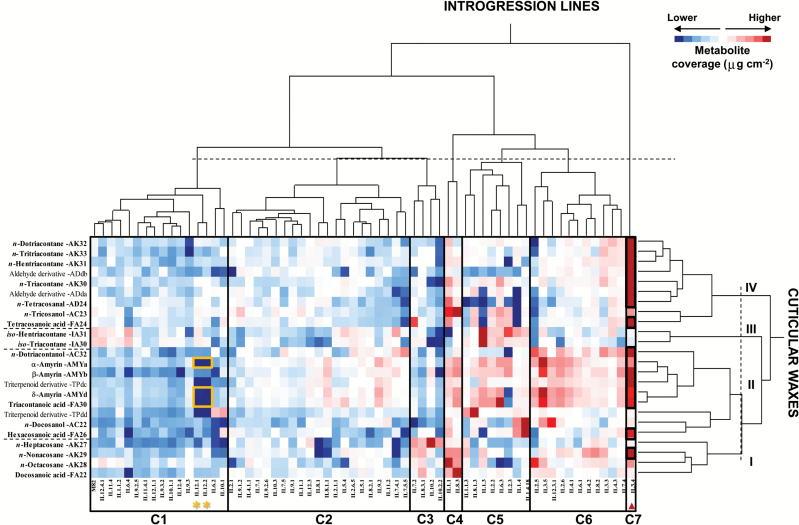
Fig. 2.
Two-way hierarchical clustering heatmap of cuticular waxes and S. pennellii ILs. The ILs were grouped into seven clusters (C1–C7); cuticular waxes were classified into four clusters (I–IV). Wax coverage (μg cm−2) for each compound in every line is represented by a colored gradient, the intensity of which ranges from dark blue, corresponding to lower wax accumulation levels, to dark red, corresponding to higher wax accumulation levels. The vlcfa3.4 and amy3.4 QTLs in IL3.4, containing cuticular waxes with different levels of accumulation relative to the parental S. lycopersicum M82 (black squares) in the second-year experiments (Student’s t test, α<0.05) are highlighted with a red triangle. Asterisks indicate the amy12.1 QTL also described in previous reports (Yeats et al., 2012; Bolger et al., 2014; Ofner et al., 2016). (This figure is available in colour at JXB online.)

