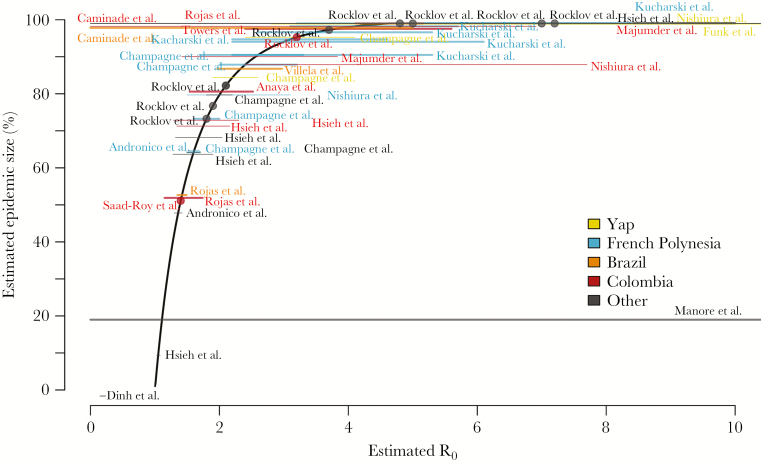
Figure 2.
R0 estimates and theoretical epidemic size. Location-specific R0 estimates are shown superimposed on the theoretical relationship between R0 and final epidemic size in a perfectly mixed population. Horizontal lines represent the reported range or 95% confidence interval of estimates when reported and are placed vertically at the epidemic size corresponding to the mean or median R_0 estimate. Thick lines represent national-level estimates, and thin lines represent estimates for subnational areas (eg, states or cities). Points represent estimates for which only point estimates were reported.

