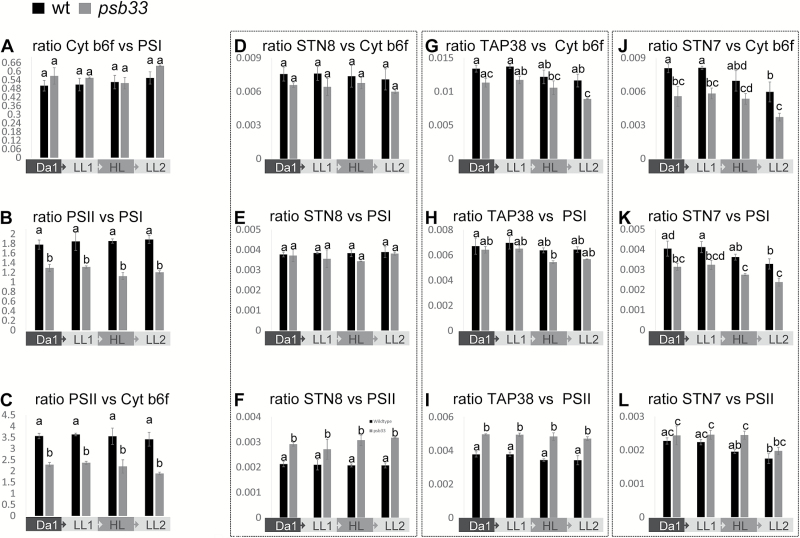
Fig. 5.
PSII and STN7 proteins are depleted in psb33 plants. Relative quantification of the major thylakoid protein complexes PSII, PSI and Cyt b6f and of the same complexes against STN8, TAP38, and STN7 by means of SRM from thylakoids of wild-type and psb33 plants sampled at the end of 16 consecutive hours of dark (Da1), 2 h of low light (LL1), 2 h of high light (HL), and another 2 h of low light (LL2). The sum of the intensities in terms of the spectral counts of at least three proteotypic peptides for each protein was used, while the numbers for PSII, PSI, and Cyt b6f are the results of the sum of three peptides from CP47 and from D2, from PsaA and from PsaB, and from Cyt b6 and from Cyt f, respectively. Bars indicate averages of two biological replicates (for psb33) and three biological replicates (wt), each with two technical replicates. Letters above bars indicate statistically significant differences determined by one-way ANOVA with Holm–Sidak’s post hoc test (P<0.05). (A) SRM relative quantification of the ratios between Cyt b6f and PSI, demonstrating no differences between genotypes and light treatments. (B) SRM relative quantification of the ratios between PSII and PSI and (C) PSII and Cyt b6f, demonstrating a significantly lower amount of PSII in psb33 plants. (D) SRM relative quantification of the ratios of STN8 versus Cyt b6f, (E) versus PSI and (F) versus PSII, demonstrating that the STN8 level is not affected by a lower PSII amount. (G) SRM relative quantification of the ratios of TAP38 versus Cyt b6f, (H) versus PSI and (I) versus PSII, showing no major differences, as in the case of STN8. (J) SRM relative quantification of the ratios between STN7 and Cyt b6f (K) and PSI, demonstrating significant degradation of STN7 after HL treatment in both genotypes, and (L) the ratio between STN7 and PSII, demonstrating a lower amount of STN7 when PSII is depleted in psb33 samples, unlike STN8 and TAP38.

