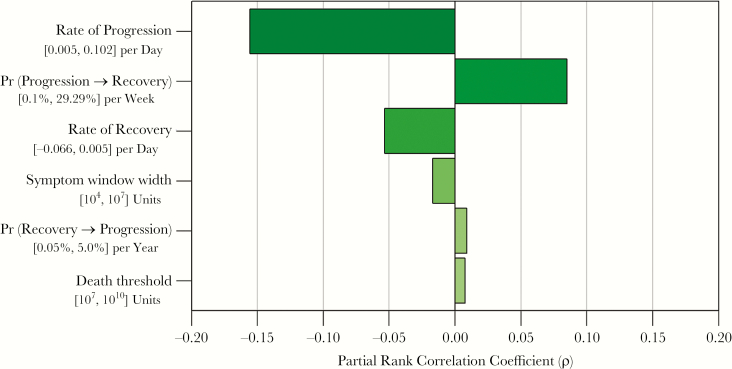
Figure 4.
Association between key model parameters and population-level clinical results. Each bar represents the partial rank correlation coefficient of the association between each model parameter and the joint likelihood of cohort results (ie, how closely each cohort fits the observed data). Beneath each parameter label is the sampling range from which parameter values were sampled.

