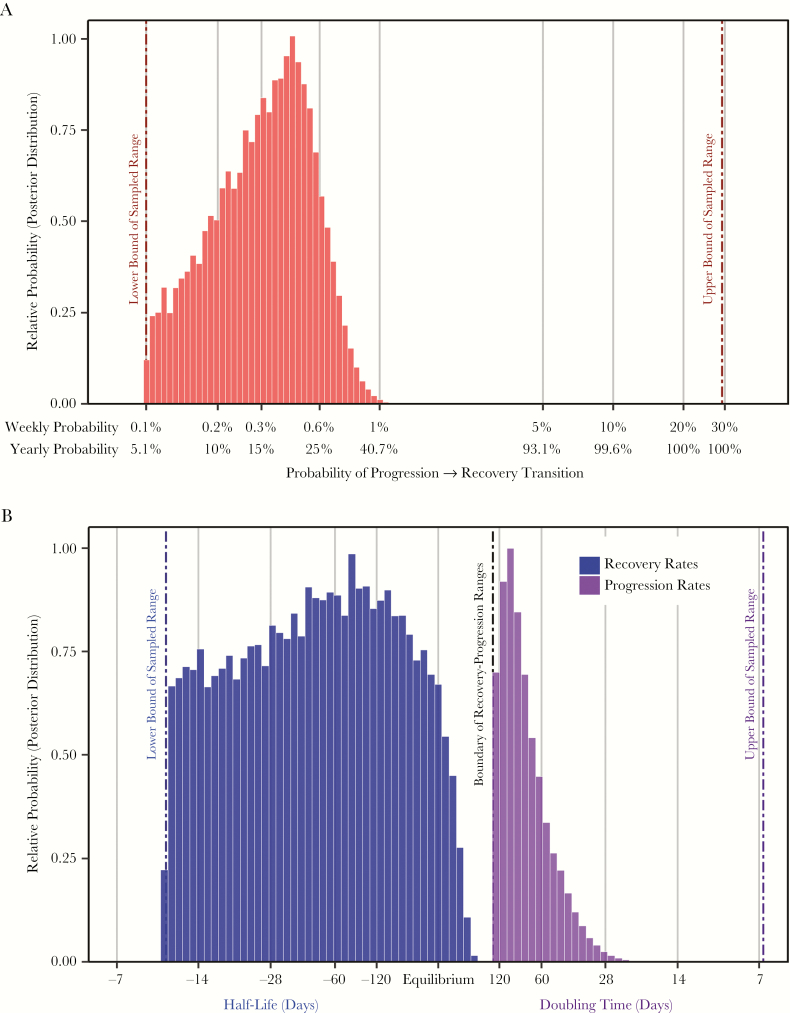
Figure 5.
Values of key parameters consistent with observed cohort data. Model input values (prior distributions) were sampled uniformly on log-transformed or log-modulus-transformed scales between reasonable bounds selected on an a priori basis (denoted by vertical dashed lines). Histogram densities show the proportion of 2 million weighted parameter values that were most consistent with observed cohort data from the prechemotherapy era (posterior distributions). A, Distributions of probabilities of transition from progression phase to recovery phase on weekly and annualized scales. Simulations most consistent with observed data therefore primarily contain transition probabilities in the lower half of the initially sampled range (ie, left-hand portion of the graph). The median transition probability among these data-consistent simulations (16% per year) implies that 50% of patients transition within 4.2 years (0.5 = e−0.16 × 4.2), provided they survive that long. B, Distributions of progression rates and recovery rates during the progression phase (gray) and the recovery phase (black). In this graph, a progression/recovery rate of zero implies no change in disease burden with time. Recovery rates less than zero are therefore also displayed as half-lives (ie, duration of time required for the disease burden to be cut in half), while progression rates are displayed as doubling times (ie, duration of time required for the disease burden to double).

