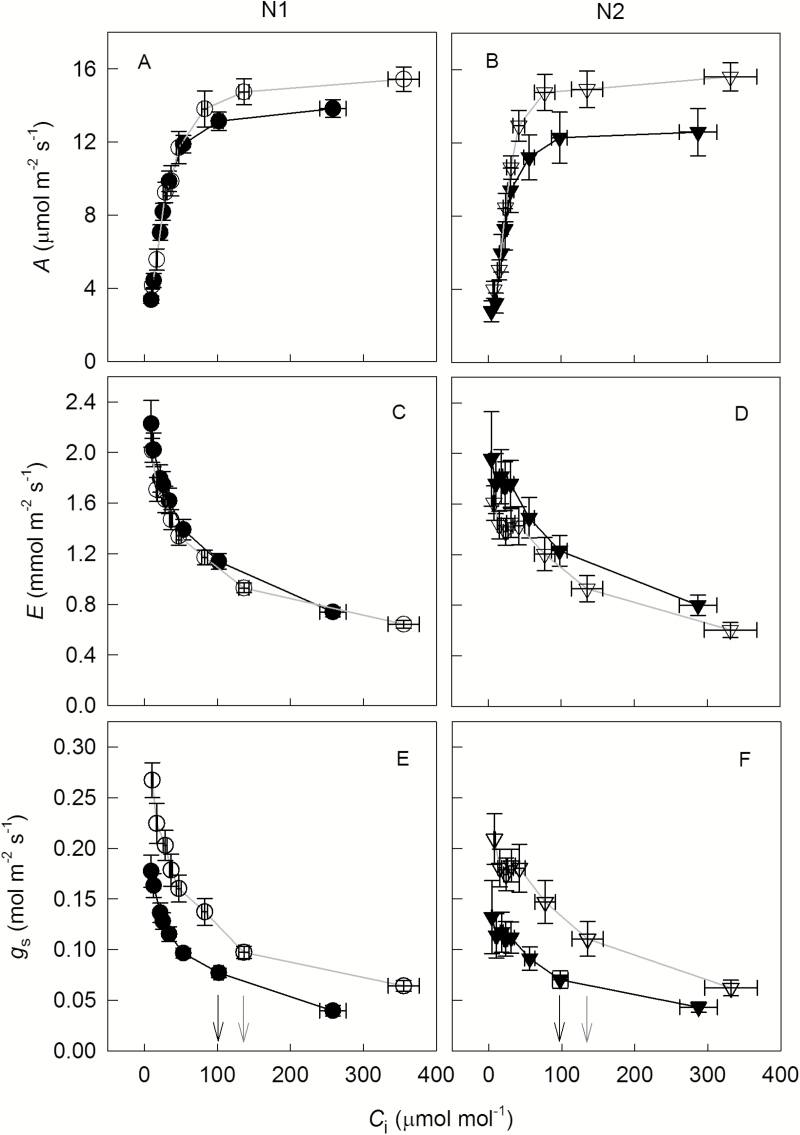
Fig. 1.
Net CO2 assimilation rate (A; A, B), transpiration rate (E; C, D) and stomatal conductance to water vapour (gs; E, F) in response to short-term variation of intercellular CO2 (Ci) under low (N1, circles; A, C, E) or high N supply (N2, triangles; B, D, F) combined with low (V1, open symbols) or high VPD (V2, filled symbols). Data are shown as the mean±SE (n=9–10). Operating conditions of gas exchange measurements were the same as conditions in growth chambers (leaf temperature 25 °C, PPFD 800 μmol m−2 s−1, VPD 0.8 kPa for V1 and 1.6 kPa for V2). The corresponding Ci values at growth CO2 concentration (390 μmol mol−1) are indicated by grey (low VPD) and black arrows (high VPD) in (E) and (F).

