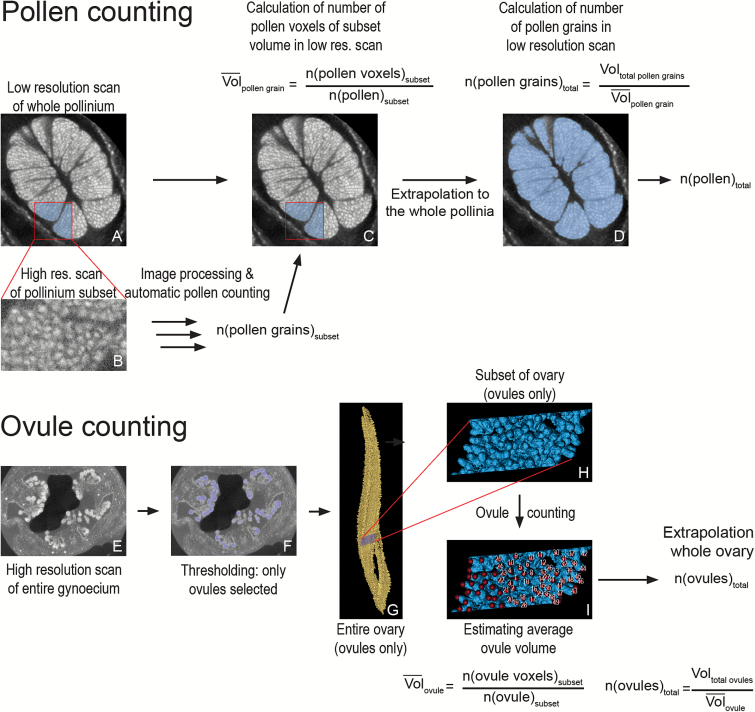
Fig. 3.
Workflows for object counting. (A–D) Workflow for counting when individual objects cannot be resolved on a scan of the whole tissue, e.g. pollen in orchid pollinium. (A) Reconstructed section through a pollinium with the subset area highlighted in blue. (B) Reconstructed section of a high-resolution scan of the subset area (raw data). After image processing and automated object counting, the number of grains in the subset is calculated. (C) The number of pollen grains in the subset is used to calculate the average volume of a pollen grain in the overview scan. (D) The average volume of a pollen grain in the overview scan is used to calculate total pollen grain number. (E–I) Workflow for counting when individual objects can be resolved on a scan of the whole tissue, e.g. ovules in orchid ovary. (E) Reconstructed section through ovary. (F) Thresholding of ovules in ovary (section). (G) Thresholding of ovules in ovary (3D model), with the subset highlighted in blue. (H) 3D model of the subset. (I) Counting of ovules in the subset (using the landmark function in AMIRA, which registers how many points have been set). This count allows the estimation of the average volume of a single ovule. This value is then used to obtain the total ovule number.

