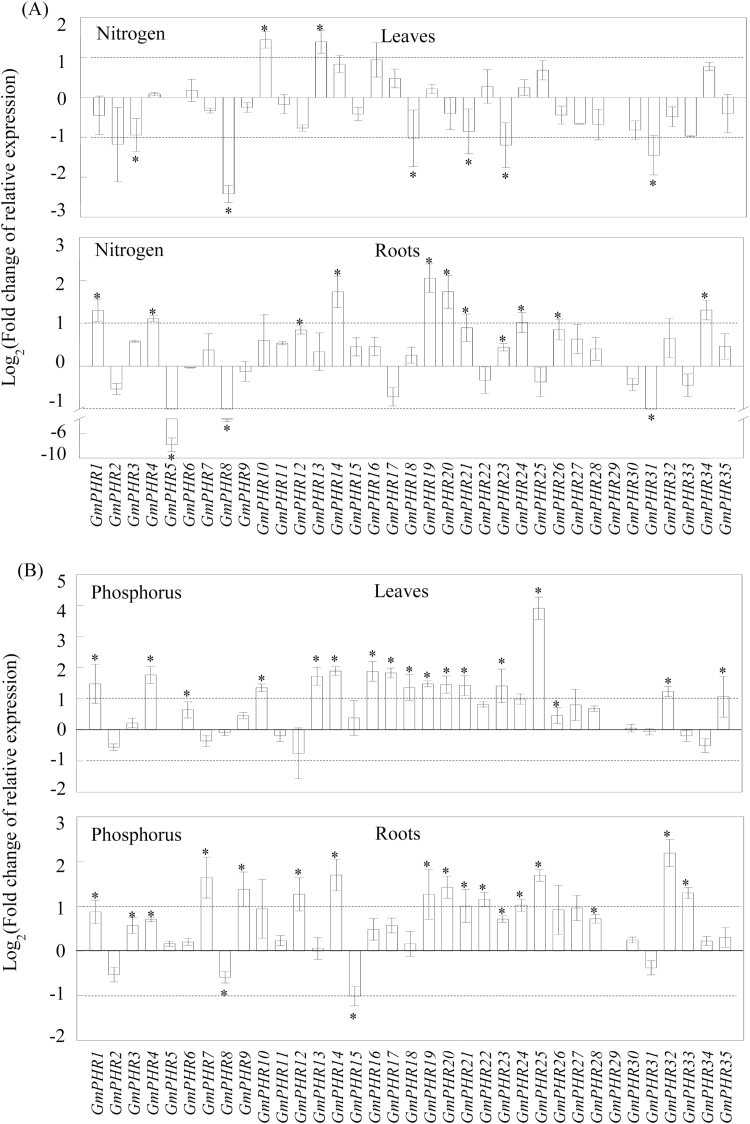
Fig. 3.
Expression patterns of GmPHR members in response to nitrogen and phosphorus deficiency in leaves and roots. Soybean seedlings were grown for 14 d in complete nutrient solution as a control, or in nutrient solution without nitrogen (A) or phosphorus (B). Data are means of four replicates ±SE, expressed as the binary logarithm of fold-changes of relative expression of GmPHR members under nutrient deficiency compared with normal conditions. *, Significant difference between normal and nutrient deficiency treatments (Student’s t-test, P<0.05).

