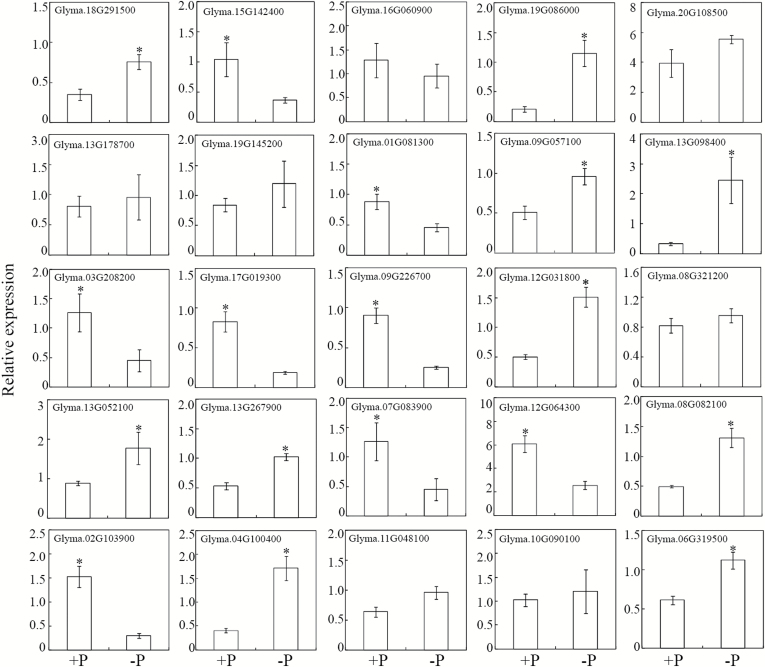
Fig. 5.
Transcription levels of genes encoding Pi-starvation down-regulated CWPs. qRT-PCR was conducted to analyse gene expression in roots subjected to +P (250 μM KH2PO4) or –P (5 μM KH2PO4) treatments. Data are means of four independent replicates ±SE. Asterisks indicate significant differences between the two P treatments: *P<0.05.

