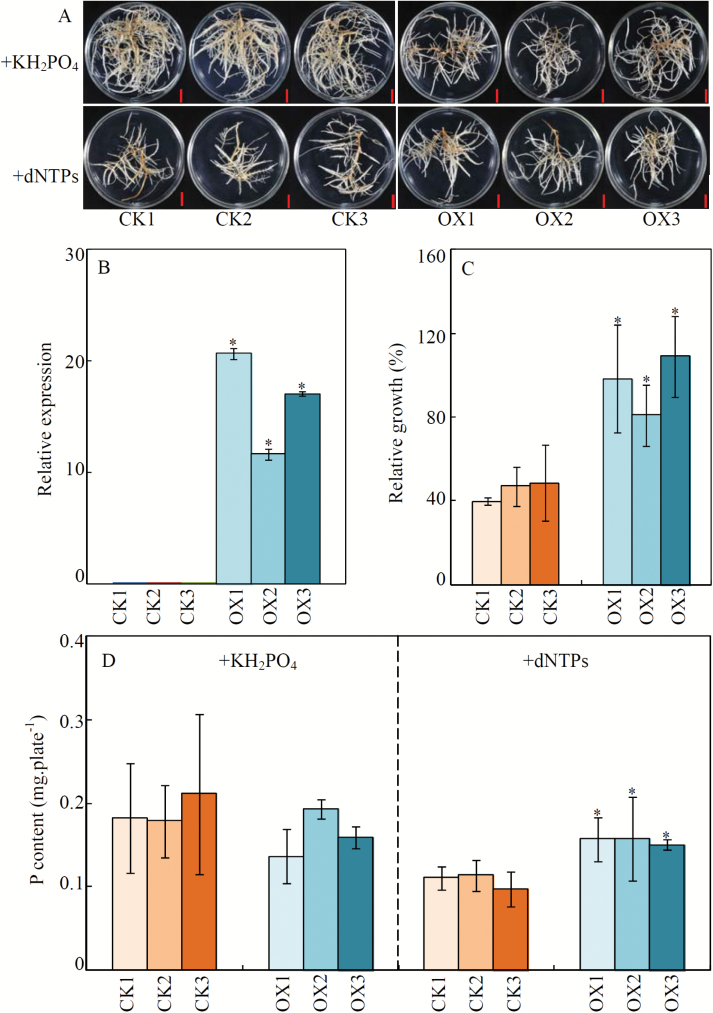
Fig. 8.
Growth and P content of transgenic bean hairy roots supplied with different P sources. (A) Phenotypes of transgenic bean hairy roots supplied with different P sources. Scale bars are 1 cm. (B) Expression levels of GmPAP1-like in transgenic been hairy roots. (C) Relative growth of transgenic bean hairy roots. Relative growth (%) = 100×(Increase of fresh weight in dNTP / Increase of fresh weight in KH2PO4). (D) P content in transgenic bean hairy roots. Uniform transgenic bean hairy roots were grown on MS medium supplied with 1.2 mM KH2PO4 or 0.4 mM dNTP for 14 d. Fresh weight and P content were measured, and the fresh weight was further used for the calculation of relative growth of the roots. CK1, CK2, and CK3 are three transgenic lines transformed with an empty vector; OX1, OX2, and OX3 represent transgenic lines with GmPAP1-like overexpression. Data are means of four biological replicates ±SE. Asterisks indicate significant differences between GmPAP1-like overexpression lines and CK lines: *P<0.05.

