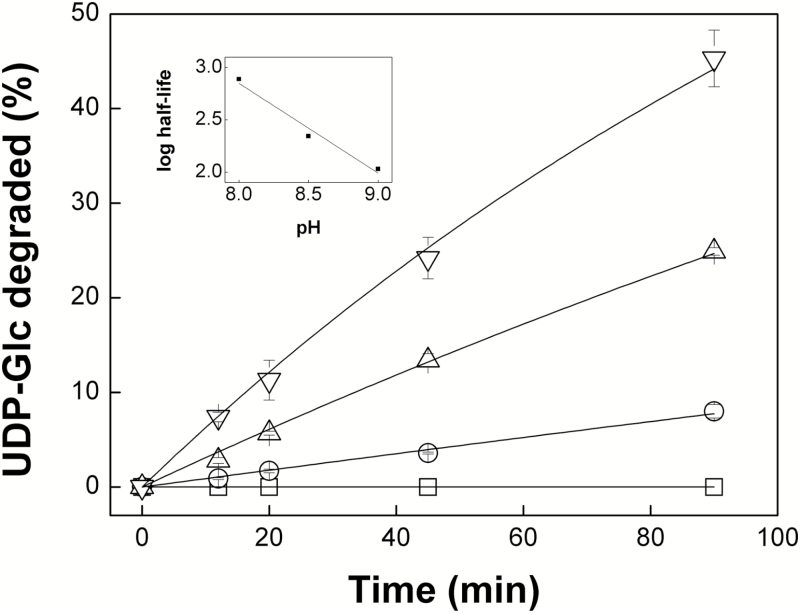
Fig. 4.
Degradation of UDP-Glc is higher at alkaline pH values. The main plot shows data derived from the NMR analysis of UDP-Glc samples that were incubated for 0, 12, 20, 45, and 90 min with 10 mM Mg2+ at pH 7.0 (square), 8.0 (circle), 8.5 (triangle) and 9.0 (inverted triangle). These curves were used to calculate the half-lives of UDP-Glc at different pH values. The inset shows the linear correlation between the log10 of the UDP-Glc half-lives and the pH.

