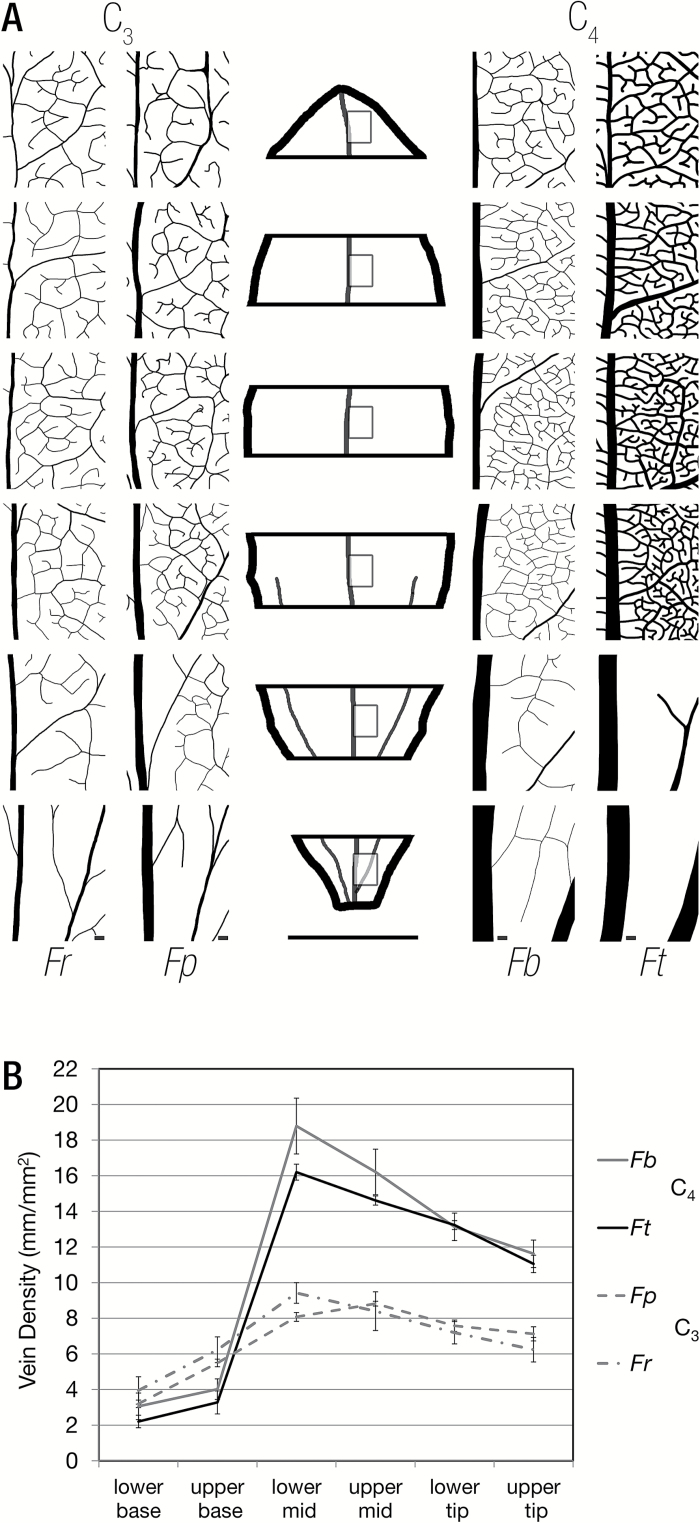
Fig. 5.
Vein density increases dramatically between the upper base and lower mid leaf sections of the C4 species compared with the C3 species. (A) Representative vein traces from base to tip of all four species illustrating the maturation of vein density. Fp, Flaveria pringlei; Fr, Flaveria robusta; Fb, Flaveria bidentis; Ft, Flaveria trinervia. The leaf outline in the centre indicates that vein density measurements were obtained from the centre of each section to the right of the midrib. (B) Quantitation of vein density in each section for the four species. In all species, vein density was highest in the middle and decreased towards the tip of leaves. A rapid increase in vein density occurs between the upper base and lower mid in both C4 species. Error bars represent 1 SE. Scale bars represent 100 μm for the vein traces and 0.5 cm for the leaf outline.

