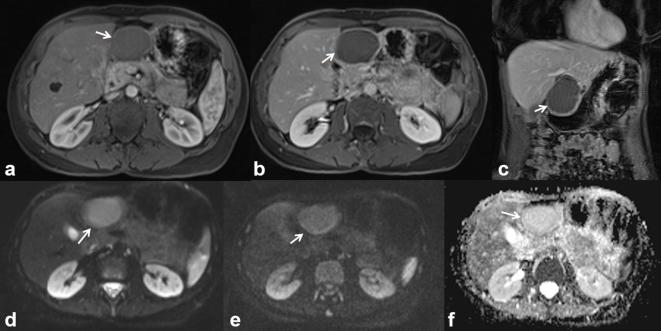
Figure 5.
The same patient of Figures 3 and 4. Arterial (a, VIBE FS T1 W, axial plane) and portal-phase images (b, VIBE FS T1 W, axial image;c, coronal image) demonstrate the mural enhancement (arrow). Diffusion sequence images (d, b50; e, b800; f, ADC map) show a restricted diffusivity with an ADC value of 1.64 × 10⁻³ mm2s–1.

