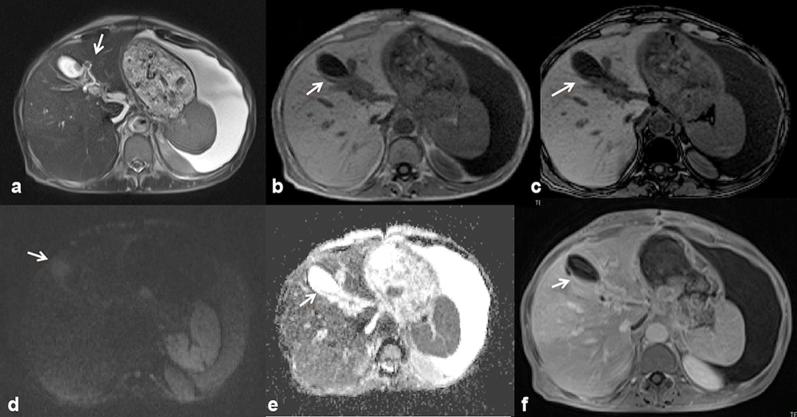
Figure 7.
53-year-old female. BT-IPMN. The lesion’s signal intensity is similar to that of the biliary ducts on the T2 W images (a, HASTE), arrow shows continuity with biliary tree. In (b) (in-of-phase T1 W in axial plane) and (c) (out-of-phase T1 W FS in axial) the lesion is hypointense (arrow); (c, maximum intensity projection). Diffusion sequence images (d, b800; e, ADC map) show a restricted diffusivity (arrow) with an ADC value of 1.42 × 10⁻³ mm2s–1. T1 W VIBE FS portal-phase image (f) shows a fluid, non-enhancing lesion (arrow). HASTE, half-Fourier acquisition single-shot turbo spin-echo.

