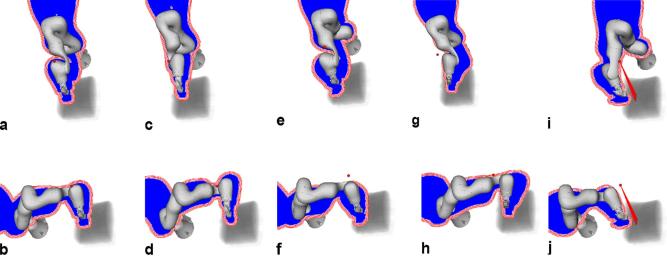
Figure 4.
The 10 robot poses considered for treatment planning relative to a volume rendering of the CT, with (a–j) showing poses 1–10, respectively. A (red) sphere denotes the beam node for which the blue projection was computed. The (red) lines around the projection illustrate the result of the distance transform used to remove overlapping beams. Note that the transform is computed to include the largest expected effective radius.

