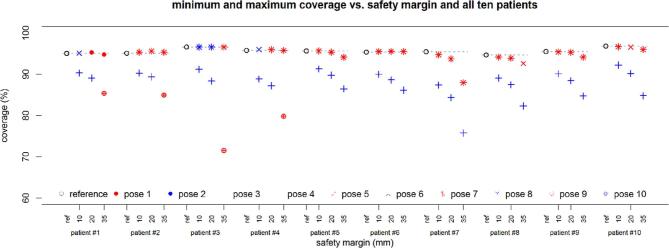
Figure 7.
Coverage as the planning objective with respect to the different safety margins for all 10 patient cases and all 10 poses. The plotted values represent the mean over 30 repeated planning experiments. For clarity, only the minimum and maximum value over the different poses and the different elbow configurations are shown. Results are given for all 10 patient cases (from left = patient 1 to right = patient 10).

