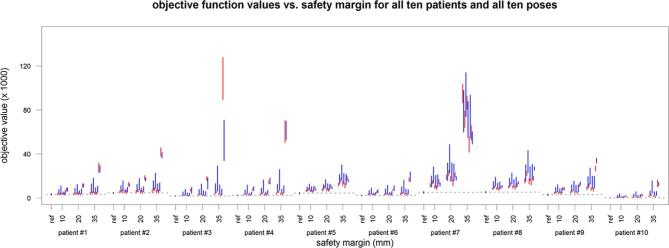
Figure 8.
The objective function value for the 10 patient cases (from left = patient 1 to right = patient 10) and the 10 poses (denoted by the blue and red from left = pose 1 to right = pose 10) in comparison to the respective reference values given in black. The lines represent the 25 to 75 quantile range and include the four different robot configurations.

