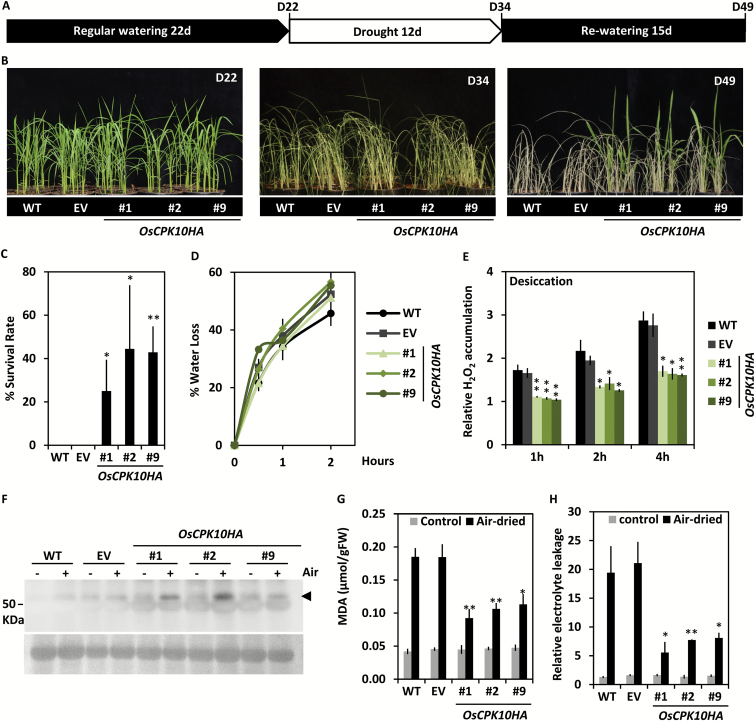
Fig. 3.
Drought tolerance of OsCPK10HA rice plants. (A) Diagram of the experimental design for drought tolerance assays. (B) Phenotypical appearance of wild-type (WT), empty vector (EV) and three OsCPK10HA lines (#1, #2, #9) at the indicated phases of the drought tolerance assay. (C) Plant survival rate after rewatering (D49). Values are the means ± standard error of the mean, of three independent assays with five plants per line. (D) Water loss rate of air-dried 10 day-old seedlings, with 9 seedlings per line. (E) H2O2 content in air-dried seedling shoots at the indicated times (h). (F) Western blot analysis of catalase (arrow) accumulation in control (-) or air-dried rice shoots (+) for 2 h. Lower panel corresponds to Ponceau staining of the membrane as a loading control. (G) MDA content, and (H) relative electrolyte leakage of seedling shoots under control conditions or after 8 h or 4 h of air-drying treatment, respectively. Values are the means ± standard error of the mean, of three biological replicates from a pool of three seedlings and three independent experiments. Asterisks show significant differences, one-way ANOVA analysis and Tukey test, *P≤0.05, **P≤0.01.
(This figure is available in colour at JXB online)

