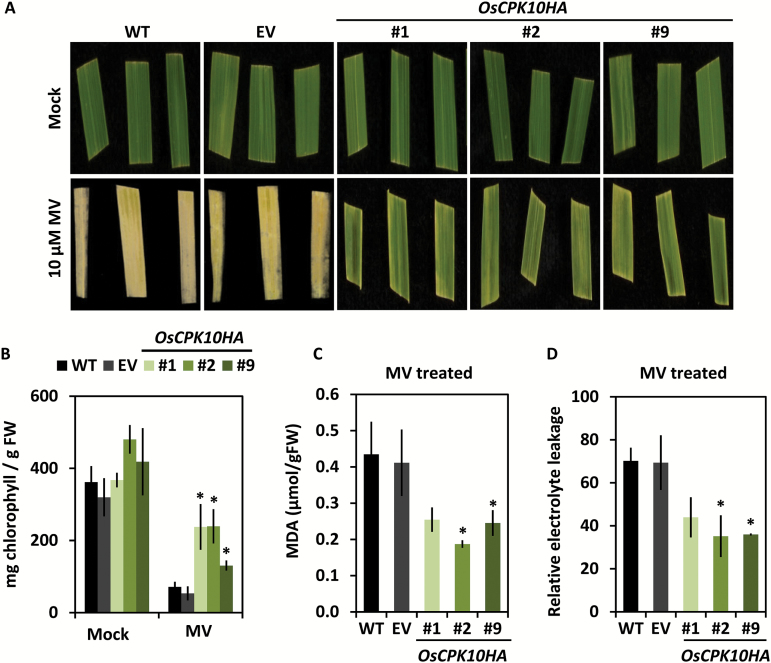
Fig. 4.
Oxidative stress tolerance of OsCPK10HA rice plants. (A) Representative images of leaf fragments of wild-type (WT), empty vector (EV) and OsCPK10HA (lines #1, #2, #9) plants treated with mock or 10 µM MV for 4 d. (B) Chlorophyll content of mock leaves or leaves treated with MV for 4 d. Values are the means ± standard error of the mean of three independent assays with four biological replicates each. (C) MDA content, and (D) relative electrolyte leakage of leaf fragments treated with MV for 2 d. Values are the means ± standard deviations of three biological replicates from a pool of three seedlings. Asterisks show significant differences, one-way ANOVA analysis and Tukey test, *P≤0.05.
(This figure is available in colour at JXB online)

