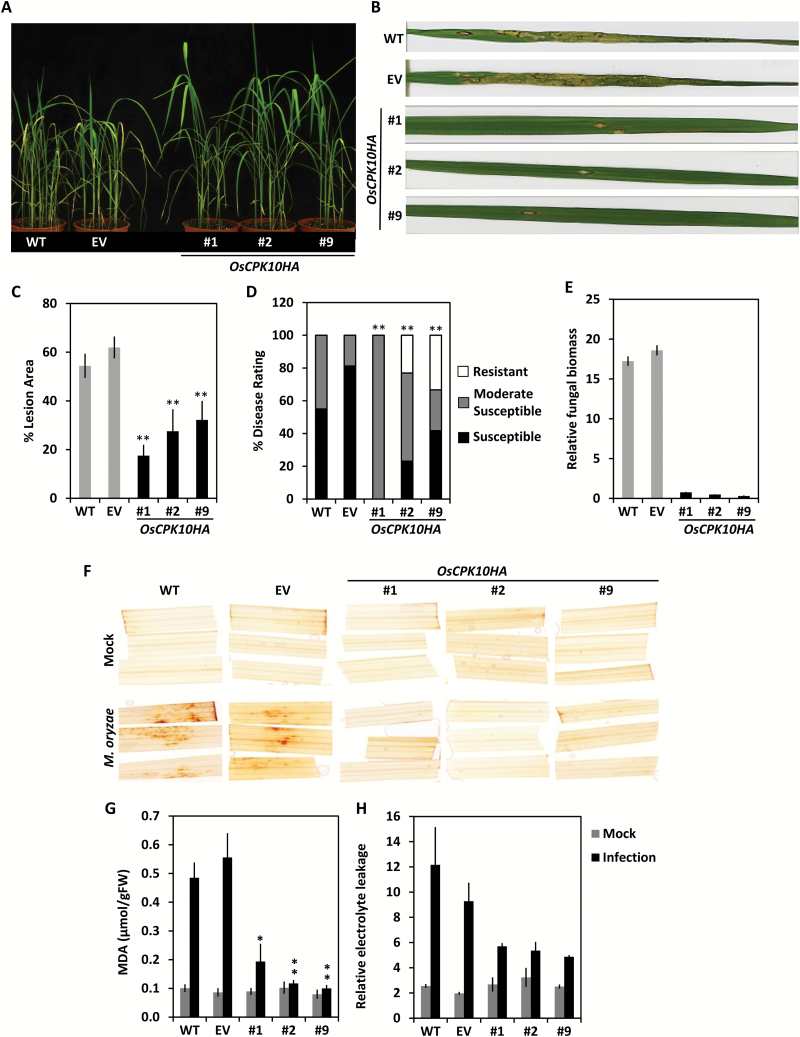
Fig. 5.
Resistance of OsCPK10HA plants to M. oryzae infection. (A) Phenotype of wild-type (WT), empty vector (EV) and three independent OsCPK10HA rice lines (#1, #2, #9) at 7 d post infection (dpi) with a M. oryzae spore suspension of 105 spore/ml. (B) Blast disease leaf symptoms in detail. (C) Average percentage of leaf lesion area. (D) Average percentage of disease rating according to the Standard Evaluation System for Blast Disease (IRRI, 1996). Values are means ± standard error of the mean of two independent assays with 10 plants per line at 7 dpi. Asterisks indicate significant differences, one-way ANOVA analysis, **P<0.01. (E) Relative fungal amount as determined by qPCR of M. oryzae 26S rDNA gene compared to rice OsUbi1 gene. Values are means ± standard deviations of three replicates with 10 plants per line in a pool at 7 dpi. (F) H2O2 accumulation by DAB staining of rice leaves at 2 dpi with mock or M. oryzae spore suspension. (G) MDA content, or (H) relative electrolyte leakage of 2 dpi rice leaves. Values are the means ± standard deviations of three biological replicates from a pool of three seedlings. Asterisks show significant differences, one-way ANOVA analysis and Tukey test, *P≤0.05, **P≤0.01.
(This figure is available in colour at JXB online)

