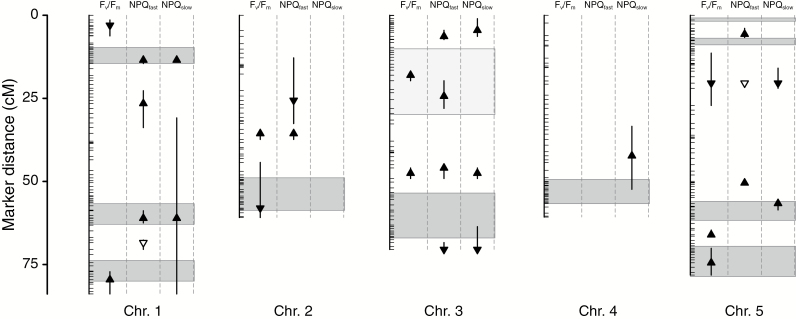
Fig. 5.
Photosynthesis QTLs detected in the present study and fitness QTLs detected in the field (from Ågren et al., 2013). Vertical lines with horizontal tick marks are the five chromosomes (Chr.) and marker positions. Distances along the chromosomes are given on the y-axis in centiMorgans (cM). Triangles represent point estimates of the location of photosynthesis QTLs (maximal quantum efficiency of PSII in the dark-adapted state, Fv/Fm; fast relaxing non-photochemical quenching, NPQfast; and slow relaxing non-photochemical quenching, NPQslow), and the direction of the arrow indicates the effect of a substitution of the Swedish genotype (upwards=greater trait value, downwards=lesser trait value). The two open triangles are QTLs involved in an epistatic interaction for NPQfast. Vertical lines for each QTL are the Bayesian 95% credible intervals around the point estimate. Shaded boxes represent the range of point estimates of fitness QTLs from field studies (from Ågren et al., 2013) where QTLs were detected in more than one year/site (darker boxes=fitness QTLs detected in both parental sites; the single lighter shaded box was detected in multiple years at the Swedish site only).

