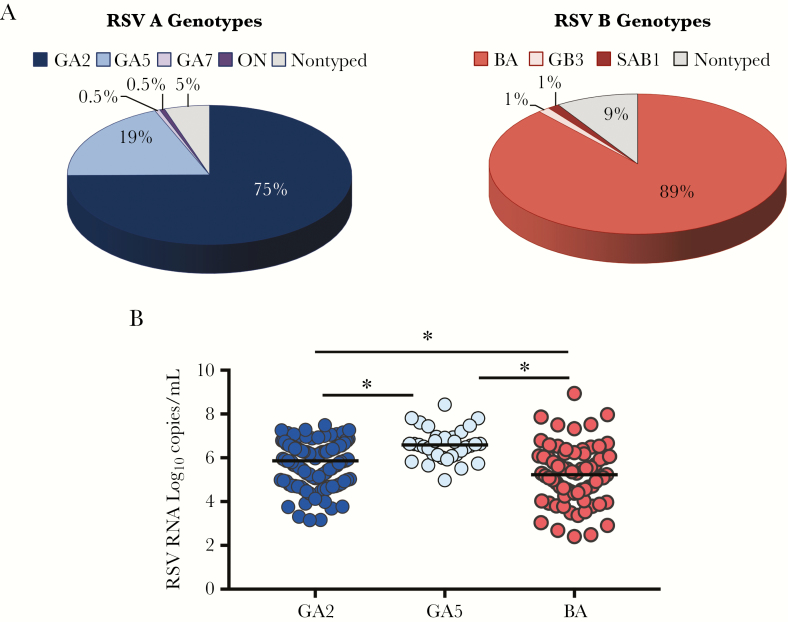
Figure 3.
Respiratory syncytial virus (RSV) distribution by genotypes and genotype loads. A, Pie graphs represent the genetic variability within RSV A and B isolates. Within RSV A genotypes, GA2 was the most commonly identified in 75% of children, followed by GA5 in 19% of patients. Of the 11 remaining RSV A genotypes, 1 corresponded to RSV GA7, 1 to the newly identified ON1 genotype, and 5% were not typed. Within the RSV B types, 88% corresponded to the BA genotype, 1 to RSV GB3, 1 to SAB1, and 9% were not typed. B, RSV genomic loads (vertical [y] axis) according to the 3 main genotypes BA (light red), GA2 (dark blue), and GA5 (light blue). Analyses performed using Kruskal–Wallis test following Benjamini–Hochberg to adjust for multiple comparisons. * Adjusted P < .05 was considered significantly different.

