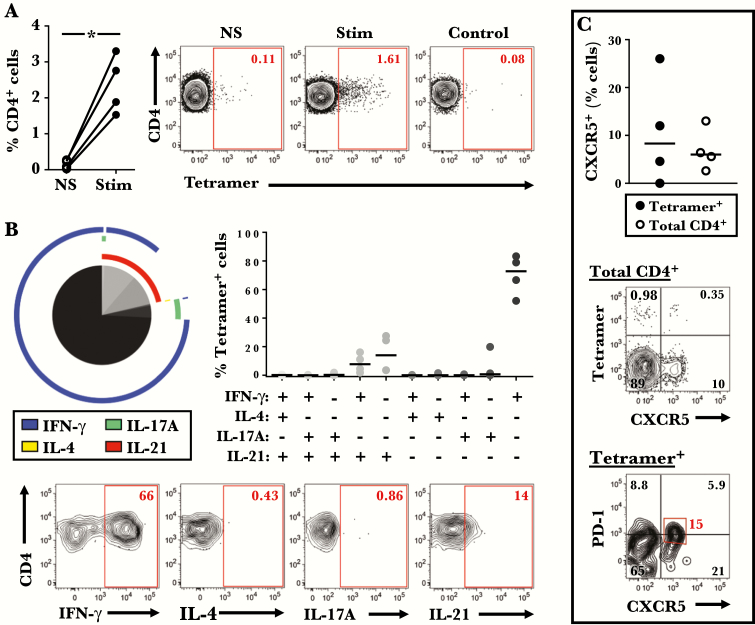
Figure 3.
Tetramer+ T cells comprise a mixture of Th1 and T follicular helper (Tfh) cells. (A) Percentage of tetramer+ cells in stimulated and unstimulated peripheral blood mononuclear cell cultures (n = 4). Representative data from 1 subject are shown on the right. *, P < .05. (B) Averaged cytokine profile of tetramer+ cells for 4 subjects (left), and the percentage of cells with a specific cytokine signature within each subject (right). Pie slices denote T-cell subsets, and colored arcs depict cytokine production. Representative contour plots are shown on the bottom. (C) Comparison of the percentage of CXCR5+ cells within tetramer+ and total CD4+ T cells (n = 4). Bars denote medians. Representative plots showing CXCR5 and PD-1 expression on tetramer+ T cells are shown on the bottom.

